Exadata flash cache for temp tablespace/GTT.

In the new version of Exadata, cell server had increased the flash cache up to about 90TB for X2-8 full rack. So it make sense to allocate the flash cache as DISK to store the high I/O segment, and ORACLE has use the flash cache as redo as default.

This post to exam the performance with flash cache as GTT storage. In the post for the GTT defined tablespace showed work around for store the GTT in defined tablespace even need parallel DML /Direct load operations on the GTT.

To exam the performance of Exadata feature, one thing need to mention — after 11gR2, ORACLE had implemented the “WRITE BACK” instead of “WRITE THROUGH” as default. “WRITE BACK” would enable the write to capture into flash cache and return back to process if the flash cache write operation faster than disk. Once return to process, the transaction considered done, and I/O locks released anyway. “WRITE BACK” enable the segments go to flash cache before hard disk in most of case (exception is I/O on hard disk faster then flash cache). “WRITE BACK” seems change the picture for store the GTT or create the temp tablespace in flash cache.

Use the same GTT to do the same operations and same set of data but no “WORK AROUND” and GTT segment final located into the default temp tablespace and flash cache should not use in old exadata version.

GTT_TAB is the Global Temp table with the tablespace defined as temp_bb, and temp_bb was created on the flask cache disk. The testing on the parallel DML to load 200M records into GTT_TAB and query on the table after commit.

First one, parallel DML directly applied and ORACLE would allocate session default temp tablespace to it.

SQL> select * from dba_temp_free_space;

TABLESPACE_NAME                     TABLESPACE_SIZE      ALLOCATED_SPACE           FREE_SPACE
------------------------------ -------------------- -------------------- --------------------
TEMP                                 80,530,636,800       80,494,985,216       80,522,248,192
TEMP_BB                                   2,088,960            1,040,384            1,048,576

SQL> truncate table gtt_tab;
Table truncated.

SQL> select statistic#, value
  2   from v$mystat
  3   where statistic# in (select statistic# from v$statname where name = 'cell flash cache read hits');

STATISTIC#      VALUE
---------- ----------
      1133          7

Elapsed: 00:00:00.01
SQL> set autotrace off
SQL> insert /*+ append enable_parallel_dml */ into gtt_tab select /*+ parallel */ * from pba_rnd;
200000000 rows created.
Elapsed: 00:00:15.53
SQL> commit;
Commit complete.
Elapsed: 00:00:00.09

SQL> select statistic#, value
  2   from v$mystat
  3   where statistic# in (select statistic# from v$statname where name = 'cell flash cache read hits');

STATISTIC#      VALUE
---------- ----------
      1133      17408     ---   17401 -- flash cache read for pba_rnd

SQL> set autotrace traceonly explain statistics
SQL> select column_name, count(*) from gtt_tab group by column_name;
4100 rows selected.

Elapsed: 00:00:30.65

Execution Plan
----------------------------------------------------------
Plan hash value: 2288548961

--------------------------------------------------------------------------------------
| Id  | Operation                  | Name    | Rows  | Bytes | Cost (%CPU)| Time     |
--------------------------------------------------------------------------------------
|   0 | SELECT STATEMENT           |         |  4020 | 44220 | 24940  (44)| 00:00:01 |
|   1 |  HASH GROUP BY             |         |  4020 | 44220 | 24940  (44)| 00:00:01 |
|   2 |   TABLE ACCESS STORAGE FULL| GTT_TAB |   200M|  2098M| 15611  (11)| 00:00:01 |
--------------------------------------------------------------------------------------

Note
-----
   - Global temporary table session private statistics used

Statistics
----------------------------------------------------------
          1  recursive calls
         13  db block gets
    1149558  consistent gets
    1149440  physical reads
         84  redo size
      92323  bytes sent via SQL*Net to client
       3377  bytes received via SQL*Net from client
        275  SQL*Net roundtrips to/from client
          0  sorts (memory)
          0  sorts (disk)
       4100  rows processed

SQL> set autotrace off
SQL> select statistic#, value
  2   from v$mystat
  3   where statistic# in (select statistic# from v$statname where name = 'cell flash cache read hits');

STATISTIC#      VALUE
---------- ----------
      1133      17779    --- 17779 - 17408  = 371  read hits. 

SQL> set autotrace traceonly 
SQL> select column_name, count(*) from gtt_tab group by column_name;
4100 rows selected.

Elapsed: 00:00:20.15

SQL> set autotrace off
SQL> select statistic#, value
  2   from v$mystat
  3   where statistic# in (select statistic# from v$statname where name = 'cell flash cache read hits');

STATISTIC#      VALUE
---------- ----------
      1133      28731    ---  After first run , second hit flash hit  28731 - 17779 = 952 

SQL>  select * from dba_temp_free_space

TABLESPACE_NAME                     TABLESPACE_SIZE      ALLOCATED_SPACE           FREE_SPACE
------------------------------ -------------------- -------------------- --------------------
TEMP                                 80,530,636,800       80,494,985,216       71,106,035,712
TEMP_BB                                   2,088,960            1,040,384            1,048,576

When GTT be truncated, new segment would be created when next time insert, if parallel DML does insert, the session base default tablespace would be used. Two facts showed here, the tablespace been used is the TEMP — session default; and flash cache be used for query on the temp tables!! — remember THERE WAS WRITE BACK on cell flash cache. — The query statistics show the flash cache was taken effective on GTT with temp tablespace in DISK.

When the GTT managed to create in flash cache disk, the performance was expected much better which been proven by others testing. However, the result was not show this, and ORACLE simply contrast flash cache with flash cache disk to store the temp tablespace.


SQL> select * from dba_temp_free_space;

TABLESPACE_NAME                     TABLESPACE_SIZE      ALLOCATED_SPACE           FREE_SPACE
------------------------------ -------------------- -------------------- --------------------
TEMP                                 80,530,636,800       80,494,985,216       80,522,248,192
TEMP_BB                              18,824,028,160       18,815,639,552       18,821,939,200

SQL> insert into gtt_tab select * from pba_rnd where rownum < 10; 9 rows created. Elapsed: 00:00:00.02 SQL> delete from gtt_tab;

9 rows deleted.

Elapsed: 00:00:00.01
SQL> commit;
Commit complete.

Elapsed: 00:00:00.00

SQL> select statistic#, value
  2   from v$mystat
  3   where statistic# in (select statistic# from v$statname where name = 'cell flash cache read hits');

STATISTIC#      VALUE
---------- ----------
      1133      28734

SQL> insert /*+ append enable_parallel_dml */ into gtt_tab select /*+ parallel */ * from pba_rnd;

200000000 rows created.

Elapsed: 00:00:16.27

SQL> select statistic#, value
  2   from v$mystat
  3   where statistic# in (select statistic# from v$statname where name = 'cell flash cache read hits');

STATISTIC#      VALUE
---------- ----------
      1133      45844      ---  increase to 45844 - 28734 = 17110 = same as GTT on hard disk. 

SQL> set autotrace traceonly explain statistics
SQL> select column_name, count(*) from gtt_tab group by column_name;

4100 rows selected.

Elapsed: 00:00:30.90

Execution Plan
----------------------------------------------------------
Plan hash value: 2288548961

--------------------------------------------------------------------------------------
| Id  | Operation                  | Name    | Rows  | Bytes | Cost (%CPU)| Time     |
--------------------------------------------------------------------------------------
|   0 | SELECT STATEMENT           |         |  4020 | 44220 | 24926  (44)| 00:00:01 |
|   1 |  HASH GROUP BY             |         |  4020 | 44220 | 24926  (44)| 00:00:01 |
|   2 |   TABLE ACCESS STORAGE FULL| GTT_TAB |   200M|  2098M| 15598  (11)| 00:00:01 |
--------------------------------------------------------------------------------------

Note
-----
   - Global temporary table session private statistics used

Statistics
----------------------------------------------------------
          1  recursive calls
         13  db block gets
    1148623  consistent gets
    1148416  physical reads
        128  redo size
      92326  bytes sent via SQL*Net to client
       3377  bytes received via SQL*Net from client
        275  SQL*Net roundtrips to/from client
          0  sorts (memory)
          0  sorts (disk)
       4100  rows processed

SQL> select statistic#, value
  2   from v$mystat
  3   where statistic# in (select statistic# from v$statname where name = 'cell flash cache read hits');

STATISTIC#      VALUE
---------- ----------
      1133      45865   -- only 21 hits on the flash cache.

SQL> select column_name, count(*) from pba_rnd group by column_name;

4100 rows selected.

Elapsed: 00:00:30.09

Execution Plan
----------------------------------------------------------
Plan hash value: 913254133

--------------------------------------------------------------------------------------
| Id  | Operation                  | Name    | Rows  | Bytes | Cost (%CPU)| Time     |
--------------------------------------------------------------------------------------
|   0 | SELECT STATEMENT           |         |  4100 | 45100 | 24946  (44)| 00:00:01 |
|   1 |  HASH GROUP BY             |         |  4100 | 45100 | 24946  (44)| 00:00:01 |
|   2 |   TABLE ACCESS STORAGE FULL| PBA_RND |   200M|  2098M| 15618  (11)| 00:00:01 |
--------------------------------------------------------------------------------------

Statistics
----------------------------------------------------------
          1  recursive calls
          9  db block gets
    1148496  consistent gets
    1148377  physical reads
          0  redo size
      92320  bytes sent via SQL*Net to client
       3377  bytes received via SQL*Net from client
        275  SQL*Net roundtrips to/from client
          0  sorts (memory)
          0  sorts (disk)
       4100  rows processed

SQL> select statistic#, value
  2   from v$mystat
  3   where statistic# in (select statistic# from v$statname where name = 'cell flash cache read hits');

STATISTIC#      VALUE
---------- ----------
      1133      45865   -- 0 hit on flash disk for GTT on flash cache disk !!!

SQL>select * from dba_temp_free_space

TABLESPACE_NAME                     TABLESPACE_SIZE      ALLOCATED_SPACE           FREE_SPACE
------------------------------ -------------------- -------------------- --------------------
TEMP                                 80,530,636,800       80,494,985,216       80,522,248,192
TEMP_BB                              18,824,028,160       18,815,639,552        9,437,184,000

The Second test was applied the “work around ” to enforce the GTT on the flash cache disk. The insert performance almost same as GTT on hard disk, the reason behind is : WRITE BACK cache , not wait for disk I/O complete to commit.
The QUERY performance is interesting, GTT on flash cache wasn’t performance better than on Hard Disk, and even worse when second time ran. Statistics showed GTT on flash cache disk total not get any hit on cell flash cache, this is make sense for ORACLE manage the flash cache I/O load. With diff way to organize the segments, in flash cache disk, segments management still as other tablespace on hard disk with file head and data block, perhaps in flash cache, address mapping may in memory which faster than flash cache, this is question need be tested and proved.

From this test, put temp tablespace into flash cache disk and store GTT into this tablespace seems would not gain any performance on query.

ORACLE Exadata Storage index saved zero bytes

Exadata storage index be used for filter the data blocks scan at cell servers level, Only full segment scan would benefit from this feature, and it would show the multiplex blocks read, and once the single block wait event happened, it mean no storage index be used.
Storage index feature would be disabled when the upgrading/datapump on going. The database properties on TIMEZONE would show the “DATAPUMP..” status.
Follow the Metalink

Doc ID 1583297.1 "Exadata: RDS Performance Degrades when Database is in Timezone Upgrade Mode" 

To remove this, for 12C, there are CDB and PDB level, the containers in CDB should be clean this status after upgrading/migrating.
Once the container in CDB on this status, storage index would not be in use. And from AWR report Top wait event would be on

 cell single block physical read

And normal exadata wait on I/O should be :

cell smart table scan

For the session level, monitor the

select a.sid, a.statistic#, b.name, value from v$mystat a, v$statname b
where a.statistic#=b.statistic#
  and a.statistic# = 433;
       SID STATISTIC# NAME                                             VALUE                                                                                                                                                            
---------- ---------- --------------------------------------------------------------                                                                                                                                                    
      1055        433 cell physical IO bytes saved by storage index  31,244,869,632                       

If value always show ZERO, then mostly storage index in cell server is not function.
Performance troubleshooting on such issue would go more complex, first fact is SQL plan all are same without change and data volume no change. So draw down to AWR report and session level statistics to fig out the root cause.

Query Parallel mode and Dynamic statistics, who will be first ?

After ORACLE version 9, most data warehouse application request for query run on parallel mode, and server’s SMP provides con-current for all the slave from parallel query.

Parallel query is designed for high performance and resource intensive operation. From Oracle 11G above, the query running mode can be control by the parallel parameters – parallel_policy , AUTO;MANUAL; LIMIT — For parallel DOP, only diff is AUTO DOP or manual via parallel hint. Optimizer alos need estimate the running time to decide whether on parallel mode, once optimizer choice the parallel mode, it need decide the DOP, using hint (still subject to downgrade); using dynamic statistics(for even distributes the work load to child processes).

But question is, how optimizer estimate the running time ? need dynamic statistics first ? or only base on the statistics in dictionary ? Or dynamic statistics will be used to estimate the running time first, then to decide the workload distribution ?

When the column histogram existing, Optimizer will respect the statistics, and decide whether will be parallel mode or not, once parallel mode had been decided, optimizer would trigger dynamic statistics for parallel degree decide and data distribution method, but no feedback to from dynamic statistics until 11g (12c adaptive plan becomes one possible method).

SQL> select /*+  */ avg(last_ddl_time-to_date('01-OCT-2010')), avg(created-to_date('01-OCT-2010')), count(*) from  test2 where owner = 'USER3' and substr(object_type,1,1)='T';

AVG(LAST_DDL_TIME-TO_DATE('01-OCT-2010')) AVG(CREATED-TO_DATE('01-OCT-2010'))   COUNT(*)
----------------------------------------- ----------------------------------- ----------
0

Elapsed: 00:00:01.86

Execution Plan
----------------------------------------------------------
Plan hash value: 2571823673

------------------------------------------------------------------------------------------------------------------------
| Id  | Operation                      | Name     | Rows  | Bytes | Cost (%CPU)| Time     |    TQ  |IN-OUT| PQ Distrib |
------------------------------------------------------------------------------------------------------------------------
|   0 | SELECT STATEMENT               |          |     1 |    38 |  6572   (4)| 00:00:01 |        |   |               |
|   1 |  SORT AGGREGATE                |          |     1 |    38 |            |          |        |   |               |
|   2 |   PX COORDINATOR               |          |       |       |            |          |        |   |               |
|   3 |    PX SEND QC (RANDOM)         | :TQ10000 |     1 |    38 |            |          |  Q1,00 | P->S | QC (RAND)  |
|   4 |     SORT AGGREGATE             |          |     1 |    38 |            |          |  Q1,00 | PCWP |            |
|   5 |      PX BLOCK ITERATOR         |          |  9860 |   365K|  6572   (4)| 00:00:01 |  Q1,00 | PCWC |            |
|*  6 |       TABLE ACCESS STORAGE FULL| TEST2    |  9860 |   365K|  6572   (4)| 00:00:01 |  Q1,00 | PCWP |            |
------------------------------------------------------------------------------------------------------------------------

Predicate Information (identified by operation id):
---------------------------------------------------

6 - storage("OWNER"='USER3' AND SUBSTR("OBJECT_TYPE",1,1)='T')
filter("OWNER"='USER3' AND SUBSTR("OBJECT_TYPE",1,1)='T')

Note
-----
- dynamic sampling used for this statement (level=5)
- automatic DOP: Computed Degree of Parallelism is 3
Statistics
----------------------------------------------------------
57  recursive calls
4  db block gets
925708  consistent gets
922163  physical reads
5124  redo size
523  bytes sent via SQL*Net to client
360  bytes received via SQL*Net from client
2  SQL*Net roundtrips to/from client
8  sorts (memory)
0  sorts (disk)
1  rows processed

SQL> select /*+  */ avg(last_ddl_time-to_date('01-OCT-2010')), avg(created-to_date('01-OCT-2010')), count(*) from  test2 where owner = 'USER2' and substr(object_type,1,1)='T';

AVG(LAST_DDL_TIME-TO_DATE('01-OCT-2010')) AVG(CREATED-TO_DATE('01-OCT-2010'))   COUNT(*)
----------------------------------------- ----------------------------------- ----------
1291.74533                          1000.87406    1065024

Elapsed: 00:02:18.32

Execution Plan
----------------------------------------------------------
Plan hash value: 1204039106

---------------------------------------------------------------------------------------------
| Id  | Operation                    | Name         | Rows  | Bytes | Cost (%CPU)| Time     |
---------------------------------------------------------------------------------------------
|   0 | SELECT STATEMENT             |              |     1 |    38 |     5   (0)| 00:00:01 |
|   1 |  SORT AGGREGATE              |              |     1 |    38 |            |          |
|*  2 |   TABLE ACCESS BY INDEX ROWID| TEST2        |     1 |    38 |     5   (0)| 00:00:01 |
|*  3 |    INDEX RANGE SCAN          | INDEX1_TEST2 |    18 |       |     4   (0)| 00:00:01 |
---------------------------------------------------------------------------------------------

Predicate Information (identified by operation id):
---------------------------------------------------

2 - filter(SUBSTR("OBJECT_TYPE",1,1)='T')
3 - access("OWNER"='USER2')

Note
-----
- automatic DOP: Computed Degree of Parallelism is 1 because of parallel threshold
Statistics
----------------------------------------------------------
1  recursive calls
0  db block gets
243503  consistent gets
174660  physical reads
12152576  redo size
569  bytes sent via SQL*Net to client
360  bytes received via SQL*Net from client
2  SQL*Net roundtrips to/from client
0  sorts (memory)
0  sorts (disk)
1  rows processed


The data in table had been change, the column with histogram, however statistics not been gathered.  Dynamic statistics only on the combined columns level, not replace the selective of column for parallel degree.

If delete all the statistics, the optimizer has no choice need force dynamic sampling on column self to decide whether need parallel mode base on the threshold (default 10 second and can control by under line parameter ), and dynamic sample on join columns would used for parallel options to be decided.

SQL> alter system flush buffer_cache;

System altered.

Elapsed: 00:00:00.06
SQL> alter system flush shared_pool;

System altered.

Elapsed: 00:00:00.01
SQL> select /*+  */ avg(last_ddl_time-to_date('01-OCT-2010')), avg(created-to_date('01-OCT-2010')), count(*) from  test2 where owner = 'USER2' and substr(object_type,1,1)='T';

AVG(LAST_DDL_TIME-TO_DATE('01-OCT-2010')) AVG(CREATED-TO_DATE('01-OCT-2010'))   COUNT(*)
----------------------------------------- ----------------------------------- ----------
                               1291.74533                          1000.87406    1065024

Elapsed: 00:00:02.34

Execution Plan
----------------------------------------------------------
Plan hash value: 2571823673

------------------------------------------------------------------------------------------------------------------------
| Id  | Operation                      | Name     | Rows  | Bytes | Cost (%CPU)| Time     |    TQ  |IN-OUT| PQ Distrib |
------------------------------------------------------------------------------------------------------------------------
|   0 | SELECT STATEMENT               |          |     1 |    46 |  6522   (3)| 00:00:01 |        |   |               |
|   1 |  SORT AGGREGATE                |          |     1 |    46 |            |          |        |   |               |
|   2 |   PX COORDINATOR               |          |       |       |            |          |        |   |               |
|   3 |    PX SEND QC (RANDOM)         | :TQ10000 |     1 |    46 |            |          |  Q1,00 | P->S | QC (RAND)  |
|   4 |     SORT AGGREGATE             |          |     1 |    46 |            |          |  Q1,00 | PCWP |            |
|   5 |      PX BLOCK ITERATOR         |          |   659K|    28M|  6522   (3)| 00:00:01 |  Q1,00 | PCWC |            |
|*  6 |       TABLE ACCESS STORAGE FULL| TEST2    |   659K|    28M|  6522   (3)| 00:00:01 |  Q1,00 | PCWP |            |
------------------------------------------------------------------------------------------------------------------------

Predicate Information (identified by operation id):
---------------------------------------------------

   6 - storage("OWNER"='USER2' AND SUBSTR("OBJECT_TYPE",1,1)='T')
       filter("OWNER"='USER2' AND SUBSTR("OBJECT_TYPE",1,1)='T')

Note
-----
   - dynamic sampling used for this statement (level=5)
   - automatic DOP: Computed Degree of Parallelism is 3


Statistics
----------------------------------------------------------
         45  recursive calls
          4  db block gets
     926142  consistent gets
     922157  physical reads
       4656  redo size
        569  bytes sent via SQL*Net to client
        360  bytes received via SQL*Net from client
          2  SQL*Net roundtrips to/from client
          6  sorts (memory)
          0  sorts (disk)
          1  rows processed

SQL> alter system flush buffer_cache;

System altered.

Elapsed: 00:00:00.06
SQL> alter system flush shared_pool;

System altered.

Elapsed: 00:00:00.00
SQL> select /*+  */ avg(last_ddl_time-to_date('01-OCT-2010')), avg(created-to_date('01-OCT-2010')), count(*) from  test2 where owner = 'USER3' and substr(object_type,1,1)='T';

AVG(LAST_DDL_TIME-TO_DATE('01-OCT-2010')) AVG(CREATED-TO_DATE('01-OCT-2010'))   COUNT(*)
----------------------------------------- ----------------------------------- ----------
                               1511.14031                          1375.30824       3402

Elapsed: 00:00:20.48

Execution Plan
----------------------------------------------------------
Plan hash value: 1204039106

---------------------------------------------------------------------------------------------
| Id  | Operation                    | Name         | Rows  | Bytes | Cost (%CPU)| Time     |
---------------------------------------------------------------------------------------------
|   0 | SELECT STATEMENT             |              |     1 |    46 |  1436   (0)| 00:00:01 |
|   1 |  SORT AGGREGATE              |              |     1 |    46 |            |          |
|*  2 |   TABLE ACCESS BY INDEX ROWID| TEST2        |  5398 |   242K|  1436   (0)| 00:00:01 |
|*  3 |    INDEX RANGE SCAN          | INDEX1_TEST2 | 10159 |       |    45   (0)| 00:00:01 |
---------------------------------------------------------------------------------------------

Predicate Information (identified by operation id):
---------------------------------------------------

   2 - filter(SUBSTR("OBJECT_TYPE",1,1)='T')
   3 - access("OWNER"='USER3')

Note
-----
   - dynamic sampling used for this statement (level=2)
   - automatic DOP: Computed Degree of Parallelism is 1 because of parallel threshold


Statistics
----------------------------------------------------------
         32  recursive calls
          0  db block gets
      28382  consistent gets
      28015  physical reads
    1458488  redo size
        567  bytes sent via SQL*Net to client
        360  bytes received via SQL*Net from client
          2  SQL*Net roundtrips to/from client
          6  sorts (memory)
          0  sorts (disk)
          1  rows processed

Dynamic sampling on the diff columns has their own target, for parallel mode base on threshold, and parallel degree/distribute method for join columns.

Dynamic Statistics during the running time

Dynamic Sampling started from ORACLE 9i, and Renamed to dynamic statistics after ORACLE 12C. Basically, dynamic statistics is just for ORACLE optimizer to build the best execution plan, Before ORACLE 12C, the SQL parsing time would do the dynamic statistics if the existing statistics in dictionary is not sufficiency.

In 11G, ORACLE provide the extended statistics to address the multiplex columns filter which no standard statistics to tell the selectivity of query, however, such extended statistics as to be built manually. From 12C, ORACLE dynamic statistics would automatically add in the columns composition into the dictionary to let the gathering statistics auto generate the statistics as extended statistics to make optimizer more accuracy to computer the  combined columns statistics even cross the tables if query has long running time with tables join.

Dynamic statistics only be triggered when no enough statistics in dictionary to let optimizer computer the selective when it is COST base, and with estimated “big” size of segment, and it should on parallel mode. dynamic statistics only be used for complex query which optimizer has to use the selective to compute the COST of access path and parallel degree.

Rule one :  Parallel Mode + Estimated Fetching size + No enough statistics (either not existing or stale) ==> Dynamic statistics

Rule two: In 11g, parallel degree under auto drop is base on the  segment level scan, and not directly related with statistics, but in 12c, degree compute will be base on the statistics, and dynamic statistics would be triggered if statistics is idle.

Rule three: When column histogram existing, optimizer will respect to the histogram even dynamic statistics been triggered.

Cases study list below is check on:

  1. Parallel policy =’AUTO’  VS  force parallel via parallel hint
  2. Has statistics VS no statistics at all
  3. Has column histogram VS no histogram but with statistics.

All the execution plan was from 11GR2, for 12C, most cases are same, but parallel degree will be diffs. This paper only study when the dynamic statistics would be triggered and how it would impact the execution plan.

Case study only on one table,

  • column “OWNER” has no-even values, “USER1” and “USER2” has 80% records, and statistics been gathered;
  • Switched “USER2” to “USER3” w/o statistics updated.
  • No. of Records owner=’USER2′ is zero. but statistics showed 80% of total records.
  • No. of Records owner=’USER3′ is 80% of Total records, ut statistics showed zero of records.
  • There is histogram statistics on “OWNER” column.

Case 1: Add parallel hint on the query with “OWNER” column and one function on the column to trigger the dynamic statistics base rule one.

SQL> select /*+ parallel(32) */ avg(last_ddl_time-sysdate), avg(created-sysdate) from  test2 where owner = 'USER2' and substr(object_type,1,3)='TAB';

AVG(LAST_DDL_TIME-SYSDATE) AVG(CREATED-SYSDATE)
-------------------------- --------------------


Elapsed: 00:00:00.68
Execution Plan
----------------------------------------------------------
Plan hash value: 2571823673

------------------------------------------------------------------------------------------------------------------------
| Id  | Operation                      | Name     | Rows  | Bytes | Cost (%CPU)| Time     |    TQ  |IN-OUT| PQ Distrib |
------------------------------------------------------------------------------------------------------------------------   
|   0 | SELECT STATEMENT               |          |     1 |    35 |   117   (6)| 00:00:01 |        |   |               |
|   1 |  SORT AGGREGATE                |          |     1 |    35 |            |          |        |   |               |
|   2 |   PX COORDINATOR               |          |       |       |            |          |        |   |               |
|   3 |    PX SEND QC (RANDOM)         | :TQ10000 |     1 |    35 |            |          |  Q1,00 | P->S | QC (RAND)  |
|   4 |     SORT AGGREGATE             |          |     1 |    35 |            |          |  Q1,00 | PCWP |            |
|   5 |      PX BLOCK ITERATOR         |          |  1800 | 63000 |   117   (6)| 00:00:01 |  Q1,00 | PCWC |            |
|*  6 |       TABLE ACCESS STORAGE FULL| TEST2    |  1800 | 63000 |   117   (6)| 00:00:01 |  Q1,00 | PCWP |            |
------------------------------------------------------------------------------------------------------------------------
Predicate Information (identified by operation id):
---------------------------------------------------
6 - storage("OWNER"='USER2' AND SUBSTR("OBJECT_TYPE",1,3)='TAB')
       filter("OWNER"='USER2' AND SUBSTR("OBJECT_TYPE",1,3)='TAB')

Note
-----
   - dynamic sampling used for this statement (level=5)
   - Degree of Parallelism is 32 because of hint


Statistics
----------------------------------------------------------
        176  recursive calls
          0  db block gets
     200701  consistent gets
     171375  physical reads
    3817584  redo size
        433  bytes sent via SQL*Net to client
        360  bytes received via SQL*Net from client
          2  SQL*Net roundtrips to/from client
          7  sorts (memory)
          0  sorts (disk)
          1  rows processed

It ran with dynamic statistics due to force parallel and statistics histogram showed fetching size is Big.

SQL> select /*+ parallel(32) */ avg(last_ddl_time-sysdate), avg(created-sysdate) from  test2 where owner = 'USER3' and substr(object_type,1,3)='TAB';

AVG(LAST_DDL_TIME-SYSDATE) AVG(CREATED-SYSDATE)
-------------------------- --------------------
                -577.32249           -870.46987

Elapsed: 00:00:16.08

Execution Plan
----------------------------------------------------------
Plan hash value: 1204039106

---------------------------------------------------------------------------------------------
| Id  | Operation                    | Name         | Rows  | Bytes | Cost (%CPU)| Time     |
---------------------------------------------------------------------------------------------
|   0 | SELECT STATEMENT             |              |     1 |    35 |    24   (0)| 00:00:01 |
|   1 |  SORT AGGREGATE              |              |     1 |    35 |            |          |
|*  2 |   TABLE ACCESS BY INDEX ROWID| TEST2        |   955K|    31M|    24   (0)| 00:00:01 |
|*  3 |    INDEX RANGE SCAN          | INDEX1_TEST2 |   889 |       |     5   (0)| 00:00:01 |
---------------------------------------------------------------------------------------------

Predicate Information (identified by operation id):
---------------------------------------------------

   2 - filter(SUBSTR("OBJECT_TYPE",1,3)='TAB')
   3 - access("OWNER"='USER3')

Note
-----
   - dynamic sampling used for this statement (level=5)
   - Degree of Parallelism is 1 because of hint

Statistics
----------------------------------------------------------
          4  recursive calls
          0  db block gets
      86487  consistent gets
       9845  physical reads
     600732  redo size
        475  bytes sent via SQL*Net to client
        360  bytes received via SQL*Net from client
          2  SQL*Net roundtrips to/from client
          0  sorts (memory)
          0  sorts (disk)
          1  rows processed

Even USER3 has 80% of records, and It ran with dynamic statistics on two columns composite statistics, and not impact the OWNER column since it had the statistics,execution plan base on histogram, and parallel degree downgrade to 1 since No. of records in histogram show zero.

SQL> select /*+ parallel(32) */ avg(last_ddl_time-sysdate), avg(created-sysdate) from  test2 where owner = 'USER1' and substr(object_type,1,3)='TAB';

AVG(LAST_DDL_TIME-SYSDATE) AVG(CREATED-SYSDATE)
-------------------------- --------------------
                -436.46116            -461.3455

Elapsed: 00:00:00.42

Execution Plan
----------------------------------------------------------
Plan hash value: 2571823673

------------------------------------------------------------------------------------------------------------------------
| Id  | Operation                      | Name     | Rows  | Bytes | Cost (%CPU)| Time     |    TQ  |IN-OUT| PQ Distrib |
------------------------------------------------------------------------------------------------------------------------
|   0 | SELECT STATEMENT               |          |     1 |    35 |   118   (6)| 00:00:01 |        |   |               |
|   1 |  SORT AGGREGATE                |          |     1 |    35 |            |          |        |   |               |
|   2 |   PX COORDINATOR               |          |       |       |            |          |        |   |               |
|   3 |    PX SEND QC (RANDOM)         | :TQ10000 |     1 |    35 |            |          |  Q1,00 | P->S | QC (RAND)  |
|   4 |     SORT AGGREGATE             |          |     1 |    35 |            |          |  Q1,00 | PCWP |            |
|   5 |      PX BLOCK ITERATOR         |          |  2423K|    80M|   118   (6)| 00:00:01 |  Q1,00 | PCWC |            |
|*  6 |       TABLE ACCESS STORAGE FULL| TEST2    |  2423K|    80M|   118   (6)| 00:00:01 |  Q1,00 | PCWP |            |
------------------------------------------------------------------------------------------------------------------------
Predicate Information (identified by operation id):
---------------------------------------------------
   6 - storage("OWNER"='USER1' AND SUBSTR("OBJECT_TYPE",1,3)='TAB')
       filter("OWNER"='USER1' AND SUBSTR("OBJECT_TYPE",1,3)='TAB')
Note
-----
   - dynamic sampling used for this statement (level=5)
   - Degree of Parallelism is 32 because of hint

Statistics
----------------------------------------------------------
        100  recursive calls
          0  db block gets
     200629  consistent gets
          0  physical reads
       2952  redo size
        475  bytes sent via SQL*Net to client
        360  bytes received via SQL*Net from client
          2  SQL*Net roundtrips to/from client
          0  sorts (memory)
          0  sorts (disk)
          1  rows processed

For column owner=’USER’, the statistics and actual distribute value is matched.
Case 2:  We drop the histogram, and keep the column OWNER statistics.

SQL> select /*+ parallel(32) */ avg(last_ddl_time-to_date('01-OCT-2010')), avg(created-to_date('01-OCT-2010')), count(*) from  test2 where owner = 'USER2' and substr(object_type,1,1)='T

AVG(LAST_DDL_TIME-TO_DATE('01-OCT-2010')) AVG(CREATED-TO_DATE('01-OCT-2010'))   COUNT(*)
----------------------------------------- ----------------------------------- ----------
                               1291.74533                          1000.87406    1065024
Elapsed: 00:00:01.04
Execution Plan
----------------------------------------------------------
Plan hash value: 2571823673
------------------------------------------------------------------------------------------------------------------------
| Id  | Operation                      | Name     | Rows  | Bytes | Cost (%CPU)| Time     |    TQ  |IN-OUT| PQ Distrib |
------------------------------------------------------------------------------------------------------------------------
|   0 | SELECT STATEMENT               |          |     1 |    38 |   612   (3)| 00:00:01 |        |   |               |
|   1 |  SORT AGGREGATE                |          |     1 |    38 |            |          |        |   |               |
|   2 |   PX COORDINATOR               |          |       |       |            |          |        |   |               |
|   3 |    PX SEND QC (RANDOM)         | :TQ10000 |     1 |    38 |            |          |  Q1,00 | P->S | QC (RAND)  |
|   4 |     SORT AGGREGATE             |          |     1 |    38 |            |          |  Q1,00 | PCWP |            |
|   5 |      PX BLOCK ITERATOR         |          |   640K|    23M|   612   (3)| 00:00:01 |  Q1,00 | PCWC |            |
|*  6 |       TABLE ACCESS STORAGE FULL| TEST2    |   640K|    23M|   612   (3)| 00:00:01 |  Q1,00 | PCWP |            |
------------------------------------------------------------------------------------------------------------------------

Predicate Information (identified by operation id):
---------------------------------------------------

   6 - storage("OWNER"='USER2' AND SUBSTR("OBJECT_TYPE",1,1)='T')
       filter("OWNER"='USER2' AND SUBSTR("OBJECT_TYPE",1,1)='T')

Note
-----
   - dynamic sampling used for this statement (level=5)
   - Degree of Parallelism is 32 because of hint


Statistics
----------------------------------------------------------
        135  recursive calls
          0  db block gets
     955823  consistent gets
     922152  physical reads
       4552  redo size
        569  bytes sent via SQL*Net to client
        360  bytes received via SQL*Net from client
          2  SQL*Net roundtrips to/from client
          6  sorts (memory)
          0  sorts (disk)
          1  rows processed

SQL> alter system flush buffer_cache;

System altered.

Elapsed: 00:00:00.06
SQL> alter system flush shared_pool;

System altered.

Elapsed: 00:00:00.01
SQL> select /*+ parallel(32) */ avg(last_ddl_time-to_date('01-OCT-2010')), avg(created-to_date('01-OCT-2010')), count(*) from  test2 where owner = 'USER3' and substr(object_type,1,1)='T

AVG(LAST_DDL_TIME-TO_DATE('01-OCT-2010')) AVG(CREATED-TO_DATE('01-OCT-2010'))   COUNT(*)
----------------------------------------- ----------------------------------- ----------
                               1511.14031                          1375.30824       3402

Elapsed: 00:00:01.01

Execution Plan
----------------------------------------------------------
Plan hash value: 2571823673

------------------------------------------------------------------------------------------------------------------------
| Id  | Operation                      | Name     | Rows  | Bytes | Cost (%CPU)| Time     |    TQ  |IN-OUT| PQ Distrib |
------------------------------------------------------------------------------------------------------------------------
|   0 | SELECT STATEMENT               |          |     1 |    38 |   612   (3)| 00:00:01 |        |   |               |
|   1 |  SORT AGGREGATE                |          |     1 |    38 |            |          |        |   |               |
|   2 |   PX COORDINATOR               |          |       |       |            |          |        |   |               |
|   3 |    PX SEND QC (RANDOM)         | :TQ10000 |     1 |    38 |            |          |  Q1,00 | P->S | QC (RAND)  |
|   4 |     SORT AGGREGATE             |          |     1 |    38 |            |          |  Q1,00 | PCWP |            |
|   5 |      PX BLOCK ITERATOR         |          | 18067 |   670K|   612   (3)| 00:00:01 |  Q1,00 | PCWC |            |
|*  6 |       TABLE ACCESS STORAGE FULL| TEST2    | 18067 |   670K|   612   (3)| 00:00:01 |  Q1,00 | PCWP |            |
------------------------------------------------------------------------------------------------------------------------

Predicate Information (identified by operation id):
---------------------------------------------------

   6 - storage("OWNER"='USER3' AND SUBSTR("OBJECT_TYPE",1,1)='T')
       filter("OWNER"='USER3' AND SUBSTR("OBJECT_TYPE",1,1)='T')
Note
-----
   - Degree of Parallelism is 32 because of hint

Statistics
----------------------------------------------------------
        135  recursive calls
          0  db block gets
     955823  consistent gets
     922152  physical reads
       4552  redo size
        567  bytes sent via SQL*Net to client
        360  bytes received via SQL*Net from client
          2  SQL*Net roundtrips to/from client
          6  sorts (memory)
          0  sorts (disk)
          1  rows processed

Delete the histogram, ORACLE use AVG to decide whether full table or indexes, and dynamic statistics only gather on the composite columns which no statistics on them, However, in 12C, ORACLE would automatically add the composite columns into table extended statistics.

If we delete the whole statistics, then dynamic statistics would on OWNER column and composite columns both.

Case 3: No statistics on the table.

SQL> select /*+ parallel(32) */ avg(last_ddl_time-to_date('01-OCT-2010')), avg(created-to_date('01-OCT-2010')), count(*) from  test2 where owner = 'USER2' and substr(object_type,1,1)='T';

AVG(LAST_DDL_TIME-TO_DATE('01-OCT-2010')) AVG(CREATED-TO_DATE('01-OCT-2010'))   COUNT(*)
----------------------------------------- ----------------------------------- ----------
                               1291.74533                          1000.87406    1065024

Elapsed: 00:00:01.10

Execution Plan
----------------------------------------------------------
Plan hash value: 2571823673

------------------------------------------------------------------------------------------------------------------------
| Id  | Operation                      | Name     | Rows  | Bytes | Cost (%CPU)| Time     |    TQ  |IN-OUT| PQ Distrib |
------------------------------------------------------------------------------------------------------------------------
|   0 | SELECT STATEMENT               |          |     1 |    46 |   611   (3)| 00:00:01 |        |   |               |
|   1 |  SORT AGGREGATE                |          |     1 |    46 |            |          |        |   |               |
|   2 |   PX COORDINATOR               |          |       |       |            |          |        |   |               |
|   3 |    PX SEND QC (RANDOM)         | :TQ10000 |     1 |    46 |            |          |  Q1,00 | P->S | QC (RAND)  |
|   4 |     SORT AGGREGATE             |          |     1 |    46 |            |          |  Q1,00 | PCWP |            |
|   5 |      PX BLOCK ITERATOR         |          |   659K|    28M|   611   (3)| 00:00:01 |  Q1,00 | PCWC |            |
|*  6 |       TABLE ACCESS STORAGE FULL| TEST2    |   659K|    28M|   611   (3)| 00:00:01 |  Q1,00 | PCWP |            |
------------------------------------------------------------------------------------------------------------------------

Predicate Information (identified by operation id):
---------------------------------------------------

   6 - storage("OWNER"='USER2' AND SUBSTR("OBJECT_TYPE",1,1)='T')
       filter("OWNER"='USER2' AND SUBSTR("OBJECT_TYPE",1,1)='T')
Note
-----
   - dynamic sampling used for this statement (level=5)
   - Degree of Parallelism is 32 because of hint

Statistics
----------------------------------------------------------
        129  recursive calls
          0  db block gets
     956242  consistent gets
     922154  physical reads
       4552  redo size
        569  bytes sent via SQL*Net to client
        360  bytes received via SQL*Net from client
          2  SQL*Net roundtrips to/from client
          6  sorts (memory)
          0  sorts (disk)
          1  rows processed

SQL> alter system flush buffer_cache;

System altered.

Elapsed: 00:00:00.07
SQL> alter system flush shared_pool;

System altered.

Elapsed: 00:00:00.01
SQL> select /*+ parallel(32) */ avg(last_ddl_time-to_date('01-OCT-2010')), avg(created-to_date('01-OCT-2010')), count(*) from  test2 where owner = 'USER3' and substr(object_type,1,1)='T';

AVG(LAST_DDL_TIME-TO_DATE('01-OCT-2010')) AVG(CREATED-TO_DATE('01-OCT-2010'))   COUNT(*)
----------------------------------------- ----------------------------------- ----------
                               1511.14031                          1375.30824       3402

Elapsed: 00:00:01.07

Execution Plan
----------------------------------------------------------
Plan hash value: 2571823673

------------------------------------------------------------------------------------------------------------------------
| Id  | Operation                      | Name     | Rows  | Bytes | Cost (%CPU)| Time     |    TQ  |IN-OUT| PQ Distrib |
------------------------------------------------------------------------------------------------------------------------
|   0 | SELECT STATEMENT               |          |     1 |    46 |   611   (3)| 00:00:01 |        |   |               |
|   1 |  SORT AGGREGATE                |          |     1 |    46 |            |          |        |   |               |
|   2 |   PX COORDINATOR               |          |       |       |            |          |        |   |               |
|   3 |    PX SEND QC (RANDOM)         | :TQ10000 |     1 |    46 |            |          |  Q1,00 | P->S | QC (RAND)  |
|   4 |     SORT AGGREGATE             |          |     1 |    46 |            |          |  Q1,00 | PCWP |            |
|   5 |      PX BLOCK ITERATOR         |          |  5398 |   242K|   611   (3)| 00:00:01 |  Q1,00 | PCWC |            |
|*  6 |       TABLE ACCESS STORAGE FULL| TEST2    |  5398 |   242K|   611   (3)| 00:00:01 |  Q1,00 | PCWP |            |
------------------------------------------------------------------------------------------------------------------------

Predicate Information (identified by operation id):
---------------------------------------------------

   6 - storage("OWNER"='USER3' AND SUBSTR("OBJECT_TYPE",1,1)='T')
       filter("OWNER"='USER3' AND SUBSTR("OBJECT_TYPE",1,1)='T')
Note
-----
   - dynamic sampling used for this statement (level=5)
   - Degree of Parallelism is 32 because of hint

Statistics
----------------------------------------------------------
        129  recursive calls
          0  db block gets
     956242  consistent gets
     922154  physical reads
       4552  redo size
        567  bytes sent via SQL*Net to client
        360  bytes received via SQL*Net from client
          2  SQL*Net roundtrips to/from client
          6  sorts (memory)
          0  sorts (disk)
          1  rows processed

Optimizer didn’t pick up the index even the fetching % is typical small. The reason is force parallel runs, would disable index acess. If remove the hint and set optimizer on policy = AUTO mode.

Case 5: No statistics and parallel policy = AUTO

SQL> select /*+  */ avg(last_ddl_time-to_date('01-OCT-2010')), avg(created-to_date('01-OCT-2010')), count(*) from  test2 where owner = 'USER2' and substr(object_type,1,1)='T';

AVG(LAST_DDL_TIME-TO_DATE('01-OCT-2010')) AVG(CREATED-TO_DATE('01-OCT-2010'))   COUNT(*)
----------------------------------------- ----------------------------------- ----------
                               1291.74533                          1000.87406    1065024

Elapsed: 00:00:02.34

Execution Plan
----------------------------------------------------------
Plan hash value: 2571823673

------------------------------------------------------------------------------------------------------------------------
| Id  | Operation                      | Name     | Rows  | Bytes | Cost (%CPU)| Time     |    TQ  |IN-OUT| PQ Distrib |
------------------------------------------------------------------------------------------------------------------------
|   0 | SELECT STATEMENT               |          |     1 |    46 |  6522   (3)| 00:00:01 |        |   |               |
|   1 |  SORT AGGREGATE                |          |     1 |    46 |            |          |        |   |               |
|   2 |   PX COORDINATOR               |          |       |       |            |          |        |   |               |
|   3 |    PX SEND QC (RANDOM)         | :TQ10000 |     1 |    46 |            |          |  Q1,00 | P->S | QC (RAND)  |
|   4 |     SORT AGGREGATE             |          |     1 |    46 |            |          |  Q1,00 | PCWP |            |
|   5 |      PX BLOCK ITERATOR         |          |   659K|    28M|  6522   (3)| 00:00:01 |  Q1,00 | PCWC |            |
|*  6 |       TABLE ACCESS STORAGE FULL| TEST2    |   659K|    28M|  6522   (3)| 00:00:01 |  Q1,00 | PCWP |            |
------------------------------------------------------------------------------------------------------------------------

Predicate Information (identified by operation id):
---------------------------------------------------

   6 - storage("OWNER"='USER2' AND SUBSTR("OBJECT_TYPE",1,1)='T')
       filter("OWNER"='USER2' AND SUBSTR("OBJECT_TYPE",1,1)='T')

Note
-----
   - dynamic sampling used for this statement (level=5)
   - automatic DOP: Computed Degree of Parallelism is 3


Statistics
----------------------------------------------------------
         45  recursive calls
          4  db block gets
     926142  consistent gets
     922157  physical reads
       4656  redo size
        569  bytes sent via SQL*Net to client
        360  bytes received via SQL*Net from client
          2  SQL*Net roundtrips to/from client
          6  sorts (memory)
          0  sorts (disk)
          1  rows processed

SQL> alter system flush buffer_cache;

System altered.

Elapsed: 00:00:00.06
SQL> alter system flush shared_pool;

System altered.

Elapsed: 00:00:00.00
SQL> select /*+  */ avg(last_ddl_time-to_date('01-OCT-2010')), avg(created-to_date('01-OCT-2010')), count(*) from  test2 where owner = 'USER3' and substr(object_type,1,1)='T';

AVG(LAST_DDL_TIME-TO_DATE('01-OCT-2010')) AVG(CREATED-TO_DATE('01-OCT-2010'))   COUNT(*)
----------------------------------------- ----------------------------------- ----------
                               1511.14031                          1375.30824       3402

Elapsed: 00:00:20.48

Execution Plan
----------------------------------------------------------
Plan hash value: 1204039106

---------------------------------------------------------------------------------------------
| Id  | Operation                    | Name         | Rows  | Bytes | Cost (%CPU)| Time     |
---------------------------------------------------------------------------------------------
|   0 | SELECT STATEMENT             |              |     1 |    46 |  1436   (0)| 00:00:01 |
|   1 |  SORT AGGREGATE              |              |     1 |    46 |            |          |
|*  2 |   TABLE ACCESS BY INDEX ROWID| TEST2        |  5398 |   242K|  1436   (0)| 00:00:01 |
|*  3 |    INDEX RANGE SCAN          | INDEX1_TEST2 | 10159 |       |    45   (0)| 00:00:01 |
---------------------------------------------------------------------------------------------

Predicate Information (identified by operation id):
---------------------------------------------------

   2 - filter(SUBSTR("OBJECT_TYPE",1,1)='T')
   3 - access("OWNER"='USER3')

Note
-----
   - dynamic sampling used for this statement (level=2)
   - automatic DOP: Computed Degree of Parallelism is 1 because of parallel threshold


Statistics
----------------------------------------------------------
         32  recursive calls
          0  db block gets
      28382  consistent gets
      28015  physical reads
    1458488  redo size
        567  bytes sent via SQL*Net to client
        360  bytes received via SQL*Net from client
          2  SQL*Net roundtrips to/from client
          6  sorts (memory)
          0  sorts (disk)
          1  rows processed

When policy = auto, Optimizer would estimate the running time, if less than 30 seconds (or 10 seconds), it would run parallel. Then Optimizer able to compare the cost by statistics value or dynamic statistics value.

Dynamic statistics be used for optimizer to decide the access path, but statistics in dictionary is not enough; and for optimizer to decide whether should run the parallel or not if the session on auto DOP mode. When join with other table, dynamic statistics would be gathered on the columns cross the tables, and in 12C, it may be recorded and act as extended column – cluster tables.

ORACLE EM cloud control 12c — Real Time SQL monitoring

ORACLE EM cloud control 12c — Real Time SQL monitoring

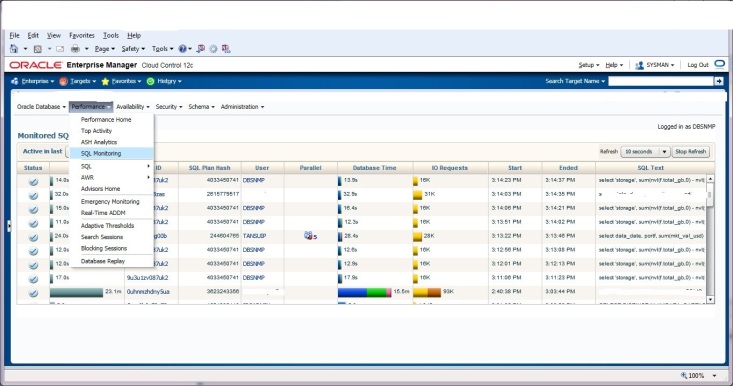
In ORACLE EM, started from 11g, there is real time SQL monitoring for monitor the query/SQL executing running time statistics, included resource usage, actual time spends in each of step. This tool is also available in SQL developer. However, sometime, you mayn’t find the fired running query, and you unable to view the online real time SQL monitoring dashboard in the EM 12c.

Most of time, DBA would lunch the SQL monitoring dashboard to do the monitoring on the running SQL, however, it would lead you to SQL Detail w/o SQL plan online statistics tab.

oem_4

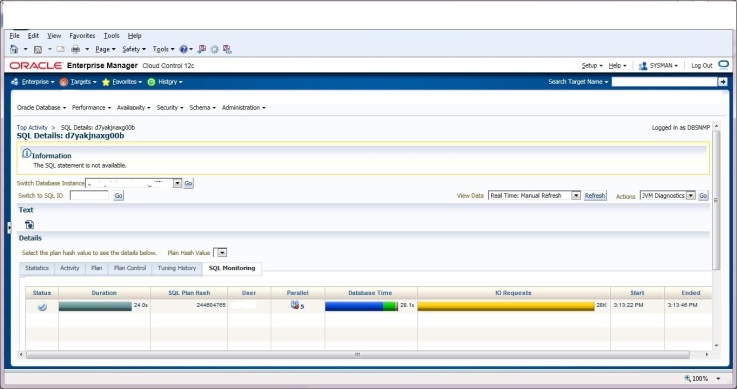
From the “Monitored SQL Executions” page, double click the SQL ID, “SQL detail page” will show up.

oem_5

This page will not display the SQL running statistics and time consuming.

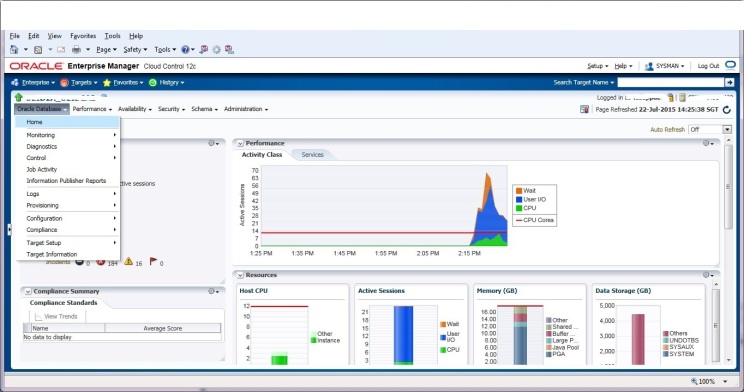
In order to do the online execution plan monitoring, you need lunch the dashboard from database home page, and find the SQL ID in the “SQL Monitor” segment.

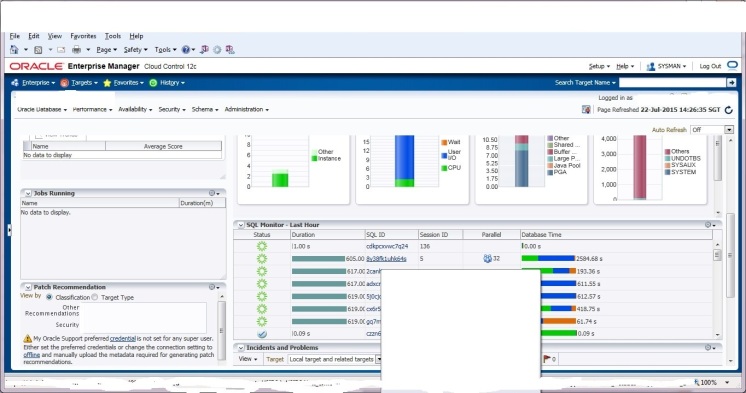
oem_1

From “SQL Monitor” section in home page, it will lead you to the monitoring dashboard for you do the performance tuning and troubleshooting.

oem_2

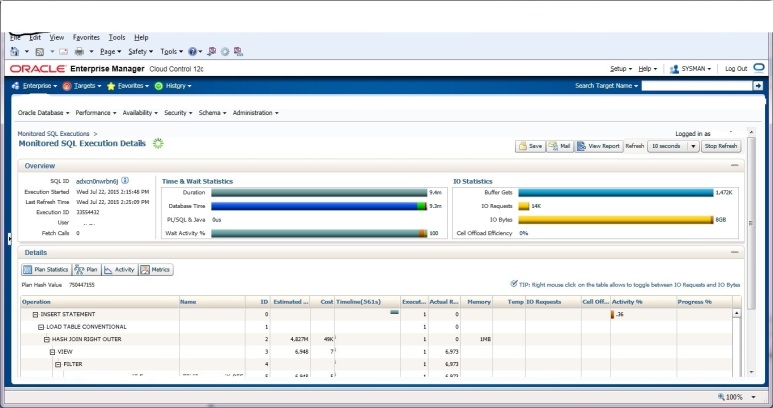
Double click the SQL ID, “Monitored SQL Execution Detail” for this SQL ID will pop up and it can be auto refreshed.

oem_3

However, sometime, you may unable to find the detail due to the plan too “big”, ORACLE internal has threshold for sql monitoring, and simply control the No. of line in plan, the default value is 300 lines. And hide parameter “_sqlmon_max_planlines” used for control this. Simple increase “_sqlmon_max_planlines” to view the “BIG” sql when the plan line exceed the threshold.

There is new column – “others” in real time SQL monitoring dashboard for DB on 12c. This column contain extract information for parallel DOP downgraded. But not available for 11G database.

Real Time SQL monitoring is the great tool to help DBA tune the SQL and troubleshooting the performance of SQL. And it is in SQL developer.


Parallel DML and rollback segment

In ORACLE transaction, rollback segment is used to store the before data block image. Inserting record will require min rollback segment , but delete and update will ask for more rollback space since old impages need be stored for rollback transaction. Transaction size for update/delete need be count in when config the undo tablespace in ORACLE database. If undo tablespace is manual management, then No. of  rollback segments and Size of rollback segments need be config according to No. of concurrent transaction and size of transaction. Application need  pick up the suitable rollback segments for their transactions. however, when parallel DML be turn on, rollback segments managment will be more complex.

From ORACLE 9i, auto undo management (AUM ) had been launched, ORACLE can allocate the rollback segments to the transaction and handle parallel DML transaction as well. But, when DB config as AUM, the application lost the control on the rollback segment specially for big transaction. And application will hit  the “ORA-01628: max # extents (32765) reached for rollback segment _SYSxxxx”  more frequencely. 

Parallel DML will performs data block change in multiplex sessions, and transaction will distrobute to child transaction, each child transaction will be one rollback segment and auto allocated by ORACLE under AUM mode. When the transaction size is huge and has high chance to hit “ORA-01628”, the possiable soultion is enable the parallel DML in the session and undo blocks will be distributed to available rollback segments depends on the degree of parallel the system can run for the transaction

1. Rollback segmentss usage in the serial DML and parallel DML

For the serial DML, the rollback segment will be only one for one transaction, and size should be same as changed blocks in the transaction.

SQL> merge /*+ parallel(a) parallel */ into par_object_list a using type_index b on (a.TYPE_ID=b.TYPE_ID)
  2  when matched then update set a.LOOP_ID = b.type_id , a.OTHER_DESC=b.TYPE_NAME;
 
881199 rows merged.
 
Elapsed: 00:00:51.47
 
SQL> r
  1  select b.name "UNDO Segment Name", b.inst# "Instance ID", b.status$ STATUS, a.ktuxesiz "UNDO Blocks", a.ktuxeusn, a.ktuxeslt xid_slot, a.ktuxesqn xid_seq, a.ktuxecfl
  2  from x$ktuxe a, undo$ b
  3* where a.ktuxesta = 'ACTIVE' and a.ktuxeusn = b.us#
 
UNDO Segment Name              Instance ID     STATUS UNDO Blocks   KTUXEUSN   XID_SLOT    XID_SEQ KTUXECFL
------------------------------ ----------- ---------- ----------- ---------- ---------- ---------- ------------------------
_SYSSMU13_896945249$                     1          3       24431         13         15     369740 NONE
 
Elapsed: 00:00:00.01

the merge DML change 881199 records and used 24431 blocks (8124 byte one block) in one rollback segment, (the Max size of segment is 8*32765 blocks).

For the same transaction, if enable parallel DML and add the parallel hint in the SQL, it ran on parallel DML mode.

SQL> alter session enable parallel dml;
 
Session altered.
 
Elapsed: 00:00:00.00
SQL> merge /*+ parallel(a) parallel */ into par_object_list a using type_index b on (a.TYPE_ID=b.TYPE_ID)
  2  when matched then update set a.LOOP_ID = b.type_id , a.OTHER_DESC=b.TYPE_NAME;
 
881199 rows merged.
 
Elapsed: 00:00:17.11
 
 
SQL> r
  1  select b.name "UNDO Segment Name", b.inst# "Instance ID", b.status$ STATUS, a.ktuxesiz "UNDO Blocks", a.ktuxeusn, a.ktuxeslt xid_slot, a.ktuxesqn xid_seq, a.ktuxecfl
  2  from x$ktuxe a, undo$ b
  3* where a.ktuxesta = 'ACTIVE' and a.ktuxeusn = b.us#
 
UNDO Segment Name              Instance ID     STATUS UNDO Blocks   KTUXEUSN   XID_SLOT    XID_SEQ KTUXECFL
------------------------------ ----------- ---------- ----------- ---------- ---------- ---------- ------------------------
_SYSSMU1_3780397527$                     2          3        1568          1         15     339161 NONE
_SYSSMU2_2232571081$                     2          3        1594          2         26     334765 NONE
_SYSSMU3_2097677531$                     2          3        1598          3         14     296724 NONE
_SYSSMU4_1152005954$                     2          3        1486          4          5     335262 NONE
_SYSSMU6_2443381498$                     2          3        1386          6          5     338601 NONE
_SYSSMU7_3286610060$                     2          3        1462          7         27     335753 NONE
_SYSSMU8_2012382730$                     2          3        1531          8          7     296203 NONE
_SYSSMU9_1424341975$                     2          3        1657          9          2     333536 NONE
_SYSSMU11_3261146618$                    1          3        1389         11          6     327540 NONE
_SYSSMU13_896945249$                     1          3        1495         13         11     369631 NONE
_SYSSMU14_275913025$                     1          3        1539         14         10     372703 NONE
_SYSSMU15_4154100692$                    1          3           0         15         32     376512 NONE
_SYSSMU16_1795321349$                    1          3        1501         16         26     334989 NONE
_SYSSMU17_3464266284$                    1          3        1594         17          5     531840 NONE
_SYSSMU18_3575979404$                    1          3        1612         18          2     363924 NONE
_SYSSMU19_2056677713$                    1          3        1481         19         16     366822 NONE
_SYSSMU20_3160523878$                    1          3        1549         20         22     364987 NONE
 
17 rows selected.

the parallel DML changed same records, and used  24442 blocks in total, however, it distributed to 16 rollback segments between 2 instances. And it used 1/3 serial time to completed.  for this transaction, the max size of rollback  (or transaction size) can be 16*8*32765 blocks if distributing evenly.

2. Is you SQL runs on parallel mode ?

As descriped above, one way to find out the transaction is on the parallel mode or not, is to check the No. of rollback segments be used. But, it need on line enquiring on the fix tables or system view. and information is instance. when transaction commit/rollback, the information would gone.  In the application deployment, check execution plan is the way to confirm whether such transaction can be on parallel mode or not.

In below is the execution plan for the “MERGE” statement ran when session enable the parallel DML.

SQL> explain plan for
merge /*+  parallel(a) parallel */ into par_object_list a using type_index b on (a.TYPE_ID=b.TYPE_ID)
when matched then update set a.LOOP_ID = b.type_id , a.OTHER_DESC=b.TYPE_NAME;  2    3
 
Explained.
 
SQL>  select * from table(dbms_xplan.display);
 
PLAN_TABLE_OUTPUT
--------------------------------------------------------------------------------------------------------------------------------------------------------------------------------------------------------
Plan hash value: 1043000430
 
------------------------------------------------------------------------------------------------------------------------------------------------
| Id  | Operation                       | Name            | Rows  | Bytes | Cost (%CPU)| Time     | Pstart| Pstop |    TQ  |IN-OUT| PQ Distrib |
------------------------------------------------------------------------------------------------------------------------------------------------
|   0 | MERGE STATEMENT                 |                 |  1210K|   208M|   188   (3)| 00:00:01 |       |       |        |      |            |
|   1 |  PX COORDINATOR                 |                 |       |       |            |          |       |       |        |      |            |
|   2 |   PX SEND QC (RANDOM)           | :TQ10002        |  1210K|   213M|   188   (3)| 00:00:01 |       |       |  Q1,02 | P->S | QC (RAND)  |
|   3 |    MERGE                        | PAR_OBJECT_LIST |       |       |            |          |       |       |  Q1,02 | PCWP |            |
|   4 |     PX RECEIVE                  |                 |  1210K|   213M|   188   (3)| 00:00:01 |       |       |  Q1,02 | PCWP |            |
|   5 |      PX SEND HYBRID (ROWID PKEY)| :TQ10001        |  1210K|   213M|   188   (3)| 00:00:01 |       |       |  Q1,01 | P->P | HYBRID (ROW|
|   6 |       VIEW                      |                 |       |       |            |          |       |       |  Q1,01 | PCWP |            |
|*  7 |        HASH JOIN                |                 |  1210K|   213M|   188   (3)| 00:00:01 |       |       |  Q1,01 | PCWP |            |
|   8 |         PX RECEIVE              |                 |     8 |   136 |     2   (0)| 00:00:01 |       |       |  Q1,01 | PCWP |            |
|   9 |          PX SEND BROADCAST LOCAL| :TQ10000        |     8 |   136 |     2   (0)| 00:00:01 |       |       |  Q1,00 | P->P | BCST LOCAL |
|  10 |           PX BLOCK ITERATOR     |                 |     8 |   136 |     2   (0)| 00:00:01 |       |       |  Q1,00 | PCWC |            |
|  11 |            TABLE ACCESS FULL    | TYPE_INDEX      |     8 |   136 |     2   (0)| 00:00:01 |       |       |  Q1,00 | PCWP |            |
|  12 |         PX BLOCK ITERATOR       |                 |  1210K|   193M|   185   (3)| 00:00:01 |KEY(SQ)|KEY(SQ)|  Q1,01 | PCWC |            |
|  13 |          TABLE ACCESS FULL      | PAR_OBJECT_LIST |  1210K|   193M|   185   (3)| 00:00:01 |KEY(SQ)|KEY(SQ)|  Q1,01 | PCWP |            |
------------------------------------------------------------------------------------------------------------------------------------------------

W/O session enable parallel DML, then the execution plan will showed MERGE run path was out of parallel path. and position of  Merge will move up (ID=3 will move to ID=1). It means Merge self on the DB block changes is not running on parallel mode.

3. Conclusion

The DML runs on serial mode only can consume one rollback segment, the transaction size will depend on the MAX size of single rollback segment; Parallel DML can distribute the transaction into diff rollback segments depends on the parallel degree. The limition of transaction will be MIN of  (MAX sub-stransactions, MAX size of single rollback segment). For the partition table with full table changes, the MAX of partition size should not exceed the MAX size of parallel segments(either MAX extends or MAX size).

The parallel DML has to be turn on the parallel DML in the session, it can be global wise turn on or ad-hoc enable within the session. In most of case, parallel hint or append hint (for insert)  is be advised to add in.  For some DML, parallel hint may need add into sub-query level as well.

Bind variable peeking in distributed query

When query pass the bind variable to the remote sub-query, the query will be parsed by local database optimizer and sub-query will be parsed/run in remote database. If the local DB and remote DB are in difference versions, then bind peeking behalves will be diffs.

When local database in 11G, as showed in above, when bind variable identified as “sensitive”, then execute plan would switching or re-gen even w/o statistics gathering happened for underline objects; however if DB is 10G, the plan only be switching/re-gen after statistics (exact to say, should dependency of plan) be gathering and “_optimizer_invalidation_periodis over.

When object’s statistics in local 11g database be updated, remote sub-query would be not triggered to switching the plan or generate new plan if the DB version on 10G; and sub-query would do plan switch and generate new version only for bind variable peeking with marked as “sensitive”.

When object’s statistics in remote database be updated, sub-query in remote DB would be triggered for plan switching /generate new version for 10G, and only generate new version of plan for 11G as descript in Part 1. If the parent plan in local DB is not depended to remote objects.

Below is the test case, repeated to run ‘6t5c5czfxq3g1′ and gathered statistic in local DB 11G, and only gathered statistics in remote DB 10G at frist time,  monitor in remote DB. Bind data in local query showed NULL, and new version of execution plan would be generated after underline statistics be gathered in local 11G DB. In the remote 10G DB, even just gathered statistics only once, the execution plan would keep switch and final new version of plan be re-gen. Last round, query be called in 11G DB within “invalid interval” after statistics gathering, so no new version of plan in 11G be gathered, and in remote 10G DB, since no statistics be gathered, last execution plan be re-used.

============== before call in local ==============================

SQL> select SQL_ID, EXECUTIONS, HASH_VALUE, OLD_HASH_VALUE, PLAN_HASH_VALUE, CHILD_NUMBER, REMOTE,
LAST_ACTIVE_TIME, BIND_DATA, LAST_LOAD_TIME, IS_OBSOLETE,IS_BIND_SENSITIVE, IS_BIND_AWARE, IS_SHAREABLE
from v$sql where sql_id='6t5c5czfxq3g1';  2    3
 
SQL_ID        EXECUTIONS HASH_VALUE OLD_HASH_VALUE PLAN_HASH_VALUE CHILD_NUMBER R LAST_ACTIVE_TIME
------------- ---------- ---------- -------------- --------------- ------------ - --------------------
BIND_DATA                  LAST_LOAD_TIME                           I I I I
--------------------------- ---------------------------------------- - - - -
6t5c5czfxq3g1          3 3722120673     4132145321               0            0 Y 13-FEB-2013:17:18:10
2013-02-13/17:14:21                      N N N N
 
6t5c5czfxq3g1          1 3722120673     4132145321               0            1 Y 13-FEB-2013:17:31:00
2013-02-13/17:30:58                      N N N N
 
6t5c5czfxq3g1          4 3722120673     4132145321               0            2 Y 13-FEB-2013:17:38:18
2013-02-13/17:31:58                      N N N N
 
6t5c5czfxq3g1          1 3722120673     4132145321               0            3 Y 13-FEB-2013:17:41:25
2013-02-13/17:41:25                      N N N N
 
6t5c5czfxq3g1          1 3722120673     4132145321               0            4 Y 13-FEB-2013:17:41:53
2013-02-13/17:41:52                      N N N N
 
6t5c5czfxq3g1          6 3722120673     4132145321               0            5 Y 13-FEB-2013:17:55:13
2013-02-13/17:41:58                      N N N Y
 
 
6 rows selected.
 
================ after re-run 5 times =========================
 
SQL> r
  1  select SQL_ID, EXECUTIONS, HASH_VALUE, OLD_HASH_VALUE, PLAN_HASH_VALUE, CHILD_NUMBER, REMOTE,
  2  LAST_ACTIVE_TIME, BIND_DATA, LAST_LOAD_TIME, IS_OBSOLETE,IS_BIND_SENSITIVE, IS_BIND_AWARE, IS_SHAREABLE
  3* from v$sql where sql_id='6t5c5czfxq3g1'
 
SQL_ID        EXECUTIONS HASH_VALUE OLD_HASH_VALUE PLAN_HASH_VALUE CHILD_NUMBER R LAST_ACTIVE_TIME
------------- ---------- ---------- -------------- --------------- ------------ - --------------------
BIND_DATA                                LAST_LOAD_TIME                     I I I I
----------------------------------       ---------------------------------- - - - -
6t5c5czfxq3g1          3 3722120673     4132145321               0            0 Y 13-FEB-2013:17:18:10
2013-02-13/17:14:21                N N N N
 
6t5c5czfxq3g1          1 3722120673     4132145321               0            1 Y 13-FEB-2013:17:31:00
2013-02-13/17:30:58                N N N N
 
6t5c5czfxq3g1          4 3722120673     4132145321               0            2 Y 13-FEB-2013:17:38:18
2013-02-13/17:31:58                N N N N
 
6t5c5czfxq3g1          1 3722120673     4132145321               0            3 Y 13-FEB-2013:17:41:25
                      2013-02-13/17:41:25                N N N N
 
6t5c5czfxq3g1          1 3722120673     4132145321               0            4 Y 13-FEB-2013:17:41:53
2013-02-13/17:41:52                N N N N
 
6t5c5czfxq3g1          6 3722120673     4132145321               0            5 Y 13-FEB-2013:17:55:13
2013-02-13/17:41:58                N N N N
 
6t5c5czfxq3g1          1 3722120673     4132145321               0            6 Y 13-FEB-2013:17:56:49
2013-02-13/17:56:49                N N N N
 
6t5c5czfxq3g1          1 3722120673     4132145321               0            7 Y 13-FEB-2013:17:59:28
2013-02-13/17:59:27                N N N N
 
6t5c5czfxq3g1          1 3722120673     4132145321               0            8 Y 13-FEB-2013:18:03:40
2013-02-13/18:03:40                N N N N
 
6t5c5czfxq3g1          2 3722120673     4132145321               0            9 Y 13-FEB-2013:18:08:41
2013-02-13/18:06:09                N N N Y
 
 
10 rows selected.
 
SQL>
 
 
============== in DB 10G, remote site, before remote call ==============================
 
SQL> r
  1  select SQL_ID, EXECUTIONS, HASH_VALUE, OLD_HASH_VALUE, PLAN_HASH_VALUE, CHILD_NUMBER, REMOTE, LAST_ACTIVE_TIME, BIND_DATA, LAST_LOAD_TIME, IS_OBSOLETE
  2* from v$sql where sql_id='fva6vxg5vdn10'
 
SQL_ID        EXECUTIONS HASH_VALUE OLD_HASH_VALUE PLAN_HASH_VALUE CHILD_NUMBER R LAST_ACTIVE_TIME
------------- ---------- ---------- -------------- --------------- ------------ - --------------------
BIND_DATA                                                                  LAST_LOAD_TIME   I
-------------------------------------------------------------------------------  -----------------  -
fva6vxg5vdn10          5 3417755680     3646009071      3214516708            0 N 13-FEB-2013:17:41:25
BEDA0A200300511B5D52000101F0018003691432372D4445432D323031323A31303A35323A3333   2013-02-13/17:14:21 N
 
fva6vxg5vdn10          6 3417755680     3646009071      3214516708            1 N 13-FEB-2013:17:41:58
BEDA0A200300511B5D8E000101F0018003691432372D4445432D323031323A31303A35323A3333   2013-02-13/17:31:59 N
 
fva6vxg5vdn10          1 3417755680     3646009071      3214516708            2 N 13-FEB-2013:17:43:07
BEDA0A200300511B602B000101F0018003691432362D4A414E2D323031333A31303A35323A3034   2013-02-13/17:43:07 N
 
 
SQL> select distinct  t.sql_text SQL_TEXT,  t.PLAN_HASH_VALUE, b.name BIND_NAME,  b.value_string BIND_STRING, b.LAST_CAPTURED, b.WAS_CAPTURED
  2  from  v$sql t  join v$sql_bind_capture b  using (sql_id)
  3  where b.value_string is not null and sql_id='fva6vxg5vdn10';
 
SQL_TEXT
-------------------------------------------------------------------------------------------------------------PLAN_HASH_VALUE BIND_NAME             BIND_STRING                LAST_CAPTURED        WAS
--------------- ----------------- -------------------------- -------------------- ---
SELECT MAX("A1"."OBJECT_ID")-MIN("A1"."OBJECT_ID") FROM "PT1_V" "A1" WHERE "A1"."CREATED"=:VDATE
     3214516708 :VDATE                   27-DEC-2012:10:52:33       13-FEB-2013:17:30:58 YES
 
SELECT MAX("A1"."OBJECT_ID")-MIN("A1"."OBJECT_ID") FROM "PT1_V" "A1" WHERE "A1"."CREATED"=:VDATE
     3214516708 :VDATE                   26-JAN-2013:10:52:04       13-FEB-2013:17:43:07 YES
 
SELECT MAX("A1"."OBJECT_ID")-MIN("A1"."OBJECT_ID") FROM "PT1_V" "A1" WHERE "A1"."CREATED"=:VDATE
     3214516708 :VDATE                   27-DEC-2012:10:52:33       13-FEB-2013:17:31:58 YES
 
 
============== after remote call 5 times ===================
SQL> r
  1  select SQL_ID, EXECUTIONS, HASH_VALUE, OLD_HASH_VALUE, PLAN_HASH_VALUE, CHILD_NUMBER, REMOTE, LAST_ACTIVE_TIME, BIND_DATA, LAST_LOAD_TIME, IS_OBSOLETE
  2* from v$sql where sql_id='fva6vxg5vdn10'
 
SQL_ID        EXECUTIONS HASH_VALUE OLD_HASH_VALUE PLAN_HASH_VALUE CHILD_NUMBER R LAST_ACTIVE_TIME
------------- ---------- ---------- -------------- --------------- ------------ - --------------------
BIND_DATA                                                                  LAST_LOAD_TIME     I
-------------------------------------------------------------------------------  -----------------   -
fva6vxg5vdn10          6 3417755680     3646009071      3214516708            0 N 13-FEB-2013:17:56:49
BEDA0A200300511B635E000101F0018003691432312D5345502D323031323A30303A30303A3030   2013-02-13/17:14:21 N
 
fva6vxg5vdn10          7 3417755680     3646009071      3214516708            1 N 13-FEB-2013:17:59:25
BEDA0A200300511B63FD000101F0018003691432312D5345502D323031323A30303A30303A3030   2013-02-13/17:31:59 N
 
fva6vxg5vdn10          6 3417755680     3646009071      3214516708            2 N 13-FEB-2013:18:03:40
BEDA0A200300511B64F9000101F0018003691432312D5345502D323031323A30303A30303A3030   2013-02-13/17:43:07 N
 
fva6vxg5vdn10          2 3417755680     3646009071      3214516708            3 N 13-FEB-2013:18:08:40
BEDA0A200300511B658F000101F0018003691432312D5345502D323031323A30303A30303A3030   2013-02-13/18:06:09 N
 
 
SQL> select distinct t.sql_text SQL_TEXT,  t.PLAN_HASH_VALUE, b.name BIND_NAME,  b.value_string BIND_STRING, b.LAST_CAPTURED, b.WAS_CAPTURED
  2  from  v$sql t  join v$sql_bind_capture b  using (sql_id)
  3  where b.value_string is not null and sql_id='fva6vxg5vdn10';
 
SQL_TEXT
-------------------------------------------------------------------------------------------------------------PLAN_HASH_VALUE BIND_NAME             BIND_STRING                LAST_CAPTURED        WAS
--------------- ----------------- -------------------------- -------------------- ---
SELECT MAX("A1"."OBJECT_ID")-MIN("A1"."OBJECT_ID") FROM "PT1_V" "A1" WHERE "A1"."CREATED"=:VDATE
     3214516708 :VDATE                   21-SEP-2012:00:00:00       13-FEB-2013:18:06:07 YES
 
SELECT MAX("A1"."OBJECT_ID")-MIN("A1"."OBJECT_ID") FROM "PT1_V" "A1" WHERE "A1"."CREATED"=:VDATE
     3214516708 :VDATE                   21-SEP-2012:00:00:00       13-FEB-2013:18:03:37 YES
 
SELECT MAX("A1"."OBJECT_ID")-MIN("A1"."OBJECT_ID") FROM "PT1_V" "A1" WHERE "A1"."CREATED"=:VDATE
     3214516708 :VDATE                   21-SEP-2012:00:00:00       13-FEB-2013:17:56:46 YES
 
SELECT MAX("A1"."OBJECT_ID")-MIN("A1"."OBJECT_ID") FROM "PT1_V" "A1" WHERE "A1"."CREATED"=:VDATE
     3214516708 :VDATE                   21-SEP-2012:00:00:00       13-FEB-2013:17:59:25 YES


We did the same test in query in DB 10G and remote DB is 11G, the remote sub-query be created as “sensitive”.  At this round, we just changed the bind variable value w/o gathering statistics on the local object to invalid the execution plan(in 10G, the new version of plan only  generated after all the cached plan be re-tried).  Test case showed, remote 11G had same behalves as local query with bind peeking “sensitive”, and two plan for sub-query final on re-useable status and severed for bind variable changed in local 10G DB. In 10G DB since, since no any action to invalidate the execution plan, it just re-used one version of execution plan.  

In Local 10G DB :

SQL> select SQL_ID, EXECUTIONS, HASH_VALUE, OLD_HASH_VALUE, PLAN_HASH_VALUE, CHILD_NUMBER, REMOTE, LAST_ACTIVE_TIME, BIND_DATA, LAST_LOAD_TIME, IS_OBSOLETE
  2  from v$sql where sql_id='0v188ja00rw4a';
 
SQL_ID        EXECUTIONS HASH_VALUE OLD_HASH_VALUE PLAN_HASH_VALUE CHILD_NUMBER R LAST_ACTIVE_TIME
------------- ---------- ---------- -------------- --------------- ------------ - --------------------
BIND_DATA                  LAST_LOAD_TIME           I
-------------------------  -----------------      -
0v188ja00rw4a          8 2148266122     3380594699               0            0 Y 14-FEB-2013:18:28:01
2013-02-14/18:12:36      N
 

In remote 11G DB, two shareable plan for this sub-query with two bind values.

SQL> r
  1  select SQL_ID, EXECUTIONS, HASH_VALUE, OLD_HASH_VALUE, PLAN_HASH_VALUE, CHILD_NUMBER, REMOTE,
  2  LAST_ACTIVE_TIME, BIND_DATA, LAST_LOAD_TIME, IS_OBSOLETE,IS_BIND_SENSITIVE, IS_BIND_AWARE, IS_SHAREABLE
  3* from v$sql where sql_id='1sup3wx6g52r8'
 
SQL_ID        EXECUTIONS HASH_VALUE OLD_HASH_VALUE PLAN_HASH_VALUE CHILD_NUMBER R LAST_ACTIVE_TIME
------------- ---------- ---------- -------------- --------------- ------------ - --------------------
BIND_DATA                                LAST_LOAD_TIME          I I I I
-------------------------------------           ----------------------- - - - -
1sup3wx6g52r8          3 1290963688      258167858       599033881            0 N 14-feb-2013:18:25:21
BEDA0B200100511CB894000101C0021602C102   2013-02-14/18:12:36     N Y N N
 
1sup3wx6g52r8          3 1290963688      258167858        46243151            1 N 14-feb-2013:18:27:46
BEDA0B200100511CBB91000101C002160180            2013-02-14/18:25:22     N Y Y Y
 
1sup3wx6g52r8          2 1290963688      258167858       599033881            2 N 14-feb-2013:18:28:02
BEDA0B200100511CBBD7000101C0021602C102   2013-02-14/18:26:31     N Y Y Y

When the query and remote sub query have same bind variable, “peeking sensitive” may has diffs in local and remote database.

Appendix —  Test case on Local ORACLE 10G  and remote 11g with  Bind variable peeking


---- In local 10G, 
 
SQL> r
  1* select max(object_id) from object_list@tio2 where type_id = :vtype
 
MAX(OBJECT_ID)
--------------
        152388
 
---- In remote 11G DB
 
SQL> select SQL_ID, EXECUTIONS, HASH_VALUE, OLD_HASH_VALUE, PLAN_HASH_VALUE, CHILD_NUMBER, REMOTE,
LAST_ACTIVE_TIME, BIND_DATA, LAST_LOAD_TIME, IS_OBSOLETE,IS_BIND_SENSITIVE, IS_BIND_AWARE, IS_SHAREABLE
from v$sql where sql_id='1sup3wx6g52r8'  2    3  ;
 
SQL_ID        EXECUTIONS HASH_VALUE OLD_HASH_VALUE PLAN_HASH_VALUE CHILD_NUMBER R LAST_ACTIVE_TIME
------------- ---------- ---------- -------------- --------------- ------------ - --------------------
BIND_DATA                                LAST_LOAD_TIME          I I I I
-------------------------------------           ----------------------- - - - -
1sup3wx6g52r8          3 1290963688      258167858       599033881            0 N 14-feb-2013:18:20:23
BEDA0B200100511CB894000101C0021602C102       2013-02-14/18:12:36     N Y N Y
 
 
---- In local 10G 
 
SQL> exec :vtype := 0;
 
PL/SQL procedure successfully completed.
 
SQL> select max(object_id) from object_list@tio2 where type_id = :vtype;
 
MAX(OBJECT_ID)
--------------
        152389
 
---- in remote 11G 
 
SQL> r
  1  select SQL_ID, EXECUTIONS, HASH_VALUE, OLD_HASH_VALUE, PLAN_HASH_VALUE, CHILD_NUMBER, REMOTE,
  2  LAST_ACTIVE_TIME, BIND_DATA, LAST_LOAD_TIME, IS_OBSOLETE,IS_BIND_SENSITIVE, IS_BIND_AWARE, IS_SHAREABLE
  3* from v$sql where sql_id='1sup3wx6g52r8'
 
SQL_ID        EXECUTIONS HASH_VALUE OLD_HASH_VALUE PLAN_HASH_VALUE CHILD_NUMBER R LAST_ACTIVE_TIME
------------- ---------- ---------- -------------- --------------- ------------ - --------------------
BIND_DATA                                LAST_LOAD_TIME          I I I I
-------------------------------------           ----------------------- - - - -
1sup3wx6g52r8          3 1290963688      258167858       599033881            0 N 14-feb-2013:18:25:21
BEDA0B200100511CB894000101C0021602C102   2013-02-14/18:12:36     N Y N Y
 
1sup3wx6g52r8          1 1290963688      258167858        46243151            1 N 14-feb-2013:18:25:21
BEDA0B200100511CBB91000101C002160180            2013-02-14/18:25:22     N Y Y Y
 
 
--- in local 10G
 
SQL> exec :vtype := 1;
 
PL/SQL procedure successfully completed.
 
SQL> r
  1* select max(object_id) from object_list@tio2 where type_id = :vtype
 
MAX(OBJECT_ID)
--------------
        152388
 
--- in remote 11g, and gather statistics 
 
SQL> r
  1  select SQL_ID, EXECUTIONS, HASH_VALUE, OLD_HASH_VALUE, PLAN_HASH_VALUE, CHILD_NUMBER, REMOTE,
  2  LAST_ACTIVE_TIME, BIND_DATA, LAST_LOAD_TIME, IS_OBSOLETE,IS_BIND_SENSITIVE, IS_BIND_AWARE, IS_SHAREABLE
  3* from v$sql where sql_id='1sup3wx6g52r8'
 
SQL_ID        EXECUTIONS HASH_VALUE OLD_HASH_VALUE PLAN_HASH_VALUE CHILD_NUMBER R LAST_ACTIVE_TIME
------------- ---------- ---------- -------------- --------------- ------------ - --------------------
BIND_DATA                                LAST_LOAD_TIME          I I I I
-------------------------------------           ----------------------- - - - -
1sup3wx6g52r8          3 1290963688      258167858       599033881            0 N 14-feb-2013:18:25:21
BEDA0B200100511CB894000101C0021602C102   2013-02-14/18:12:36     N Y N N
 
1sup3wx6g52r8          1 1290963688      258167858        46243151            1 N 14-feb-2013:18:26:31
BEDA0B200100511CBB91000101C002160180            2013-02-14/18:25:22     N Y Y Y
 
1sup3wx6g52r8          1 1290963688      258167858       599033881            2 N 14-feb-2013:18:26:31
BEDA0B200100511CBBD7000101C0021602C102   2013-02-14/18:26:31     N Y Y Y
 
--- in local 10G
 
SQL> exec :vtype := 0;
 
PL/SQL procedure successfully completed.
 
SQL> r
  1* select max(object_id) from object_list@tio2 where type_id = :vtype
 
MAX(OBJECT_ID)
--------------
        152389
 
--- in remote 11G
SQL> r
  1  select SQL_ID, EXECUTIONS, HASH_VALUE, OLD_HASH_VALUE, PLAN_HASH_VALUE, CHILD_NUMBER, REMOTE,
  2  LAST_ACTIVE_TIME, BIND_DATA, LAST_LOAD_TIME, IS_OBSOLETE,IS_BIND_SENSITIVE, IS_BIND_AWARE, IS_SHAREABLE
  3* from v$sql where sql_id='1sup3wx6g52r8'
 
SQL_ID        EXECUTIONS HASH_VALUE OLD_HASH_VALUE PLAN_HASH_VALUE CHILD_NUMBER R LAST_ACTIVE_TIME
------------- ---------- ---------- -------------- --------------- ------------ - --------------------
BIND_DATA                                LAST_LOAD_TIME          I I I I
-------------------------------------           ----------------------- - - - -
1sup3wx6g52r8          3 1290963688      258167858       599033881            0 N 14-feb-2013:18:25:21
BEDA0B200100511CB894000101C0021602C102   2013-02-14/18:12:36      N Y N N
 
1sup3wx6g52r8          2 1290963688      258167858        46243151            1 N 14-feb-2013:18:27:14
BEDA0B200100511CBB91000101C002160180            2013-02-14/18:25:22      N Y Y Y
 
1sup3wx6g52r8          1 1290963688      258167858       599033881            2 N 14-feb-2013:18:27:14
BEDA0B200100511CBBD7000101C0021602C102   2013-02-14/18:26:31      N Y Y Y
 
 
--- in local 10G
 
SQL> r
  1* select max(object_id) from object_list@tio2 where type_id = :vtype
 
MAX(OBJECT_ID)
--------------
        152389
 
--- in remote 11g
SQL> r
  1  select SQL_ID, EXECUTIONS, HASH_VALUE, OLD_HASH_VALUE, PLAN_HASH_VALUE, CHILD_NUMBER, REMOTE,
  2  LAST_ACTIVE_TIME, BIND_DATA, LAST_LOAD_TIME, IS_OBSOLETE,IS_BIND_SENSITIVE, IS_BIND_AWARE, IS_SHAREABLE
  3* from v$sql where sql_id='1sup3wx6g52r8'
 
SQL_ID        EXECUTIONS HASH_VALUE OLD_HASH_VALUE PLAN_HASH_VALUE CHILD_NUMBER R LAST_ACTIVE_TIME
------------- ---------- ---------- -------------- --------------- ------------ - --------------------
BIND_DATA                                LAST_LOAD_TIME          I I I I
-------------------------------------           ----------------------- - - - -
1sup3wx6g52r8          3 1290963688      258167858       599033881            0 N 14-feb-2013:18:25:21
BEDA0B200100511CB894000101C0021602C102   2013-02-14/18:12:36     N Y N N
 
1sup3wx6g52r8          3 1290963688      258167858        46243151            1 N 14-feb-2013:18:27:46
BEDA0B200100511CBB91000101C002160180            2013-02-14/18:25:22     N Y Y Y
 
1sup3wx6g52r8          1 1290963688      258167858       599033881            2 N 14-feb-2013:18:27:46
BEDA0B200100511CBBD7000101C0021602C102   2013-02-14/18:26:31     N Y Y Y
 
 
--- in local 10G 
 
SQL> exec :vtype := 1;
 
PL/SQL procedure successfully completed.
 
SQL> r
  1* select max(object_id) from object_list@tio2 where type_id = :vtype
 
MAX(OBJECT_ID)
--------------
        152388
 
------ in remote 11G
 
SQL> r
  1  select SQL_ID, EXECUTIONS, HASH_VALUE, OLD_HASH_VALUE, PLAN_HASH_VALUE, CHILD_NUMBER, REMOTE,
  2  LAST_ACTIVE_TIME, BIND_DATA, LAST_LOAD_TIME, IS_OBSOLETE,IS_BIND_SENSITIVE, IS_BIND_AWARE, IS_SHAREABLE
  3* from v$sql where sql_id='1sup3wx6g52r8'
 
SQL_ID        EXECUTIONS HASH_VALUE OLD_HASH_VALUE PLAN_HASH_VALUE CHILD_NUMBER R LAST_ACTIVE_TIME
------------- ---------- ---------- -------------- --------------- ------------ - --------------------
BIND_DATA                                LAST_LOAD_TIME          I I I I
-------------------------------------           ----------------------- - - - -
1sup3wx6g52r8          3 1290963688      258167858       599033881            0 N 14-feb-2013:18:25:21
BEDA0B200100511CB894000101C0021602C102   2013-02-14/18:12:36     N Y N N
 
1sup3wx6g52r8          3 1290963688      258167858        46243151            1 N 14-feb-2013:18:27:46
BEDA0B200100511CBB91000101C002160180            2013-02-14/18:25:22     N Y Y Y
 
1sup3wx6g52r8          2 1290963688      258167858       599033881            2 N 14-feb-2013:18:28:02
BEDA0B200100511CBBD7000101C0021602C102   2013-02-14/18:26:31     N Y Y Y


---- check the SQL plan version in local 10G 
 
SQL>  select * from v$sql_bind_capture where sql_id='0v188ja00rw4a';
 
no rows selected
 
SQL> select SQL_ID, EXECUTIONS, HASH_VALUE, OLD_HASH_VALUE, PLAN_HASH_VALUE, CHILD_NUMBER, REMOTE, LAST_ACTIVE_TIME, BIND_DATA, LAST_LOAD_TIME, IS_OBSOLETE
  2  from v$sql where sql_id='0v188ja00rw4a';
 
SQL_ID        EXECUTIONS HASH_VALUE OLD_HASH_VALUE PLAN_HASH_VALUE CHILD_NUMBER R LAST_ACTIVE_TIME
------------- ---------- ---------- -------------- --------------- ------------ - --------------------
BIND_DATA                  LAST_LOAD_TIME           I
-------------------------  -----------------      -
0v188ja00rw4a          8 2148266122     3380594699               0            0 Y 14-FEB-2013:18:28:01
2013-02-14/18:12:36      N
 

Bind variable peeking with column histogram on stewed value

In 10G, even bind variable peeking plus stewed column data, the bind variable values changing would not trigger SQL plan switching or re-gen. Execution re-gen/switch is triggered by statistics, and when it just switches, the current value of bind variables would not be used by optimizer, only new version of plan will be affected by the current captured values (captured interval trigger system to capture current bind variable value).

 In 11G, Optimizer add one attribute to check the bind variable is sensitive or not, in v$SQL view, a few columns be add in to host the bind variable new attributes : IS_BIND_SENSITIVE, IS_BIND_AWARE, IS_SHAREABLE

 If IS_BIND_SENSITIVE = ‘N’, then bind variable current value would not change the execution plans. ORACLE only add SQL with bind variable sensitive for simple filter as <column i> = <variable> and <column i> had stewed data with histogram statistics. Otherwise, Optimizer handle execution plan as Non bind variable SQL, and current bind variables’ values only be used when new version of plan be re-gen.

 For “sensitive” bind variable, new version of plan base on the actual value would be generated when value be changed.  The existing execution plans in cache has one attribute “IS_SHAREABLE”, when “sensitive” bind variable value changed, Optimizer will re-use the plan if column statistics shows the value has same distribution bulk with the captured bind variable value for this version/child number of SQL ID. If the captured time exceeds the “_cursor_bind_capture_interval”, then new captured value for this version of SQL on the execution plan will be logged, and be used in future for plan switching.

 Run :

 select max(object_id),min(object_id) from object_list where type_id < :vtype + 1

 Check the bind value and execution plan:

 SQL> r

  1  select SQL_ID, EXECUTIONS, HASH_VALUE, OLD_HASH_VALUE, PLAN_HASH_VALUE, CHILD_NUMBER, REMOTE,
  2  LAST_ACTIVE_TIME, BIND_DATA, LAST_LOAD_TIME, IS_OBSOLETE,IS_BIND_SENSITIVE, IS_BIND_AWARE, IS_SHAREABLE
  3* from v$sql where sql_id= '8abcnfd53uwpn'
 SQL_ID        EXECUTIONS HASH_VALUE OLD_HASH_VALUE PLAN_HASH_VALUE CHILD_NUMBER R LAST_ACTIVE_TIME
------------- ---------- ---------- -------------- --------------- ------------ - --------------------
BIND_DATA                                LAST_LOAD_TIME                    I I I I
---------------------------------------  -------------------------- - - - -
8abcnfd53uwpn          5 1245541044     2104998663        46243151            0 N 08-FEB-2013:09:36:54
BEDA0B20010051145657000101C002160180            2013-02-08/09:35:19           N N N Y

 For Table “object_list”, the “TYPE_ID” had stewed data and histogram had been created.  The bind variable peeking only be defined as “SENSITIVE”, if the column filter expression is directly compare with bind variable and the column  data is stewed distributed, and the column had histogram statistics.

 SQL> select * from DBA_TAB_HISTOGRAMS where table_name=’OBJECT_LIST’ and column_name=’TYPE_ID’;

 OWNER     TABLE_NAME       COLUMN_NAME   ENDPOINT_NUMBER ENDPOINT_VALUE    ENDPOINT_ACTUAL_VALUE
--------- -----------------   ------------  --------------- -------------- -----------------------
DBA1     OBJECT_LIST       TYPE_ID                                 16              0
DBA1     OBJECT_LIST       TYPE_ID               1281200              1

 Run below with /* vtyp in (0,1,2,3) */

 select max(object_id) from object_list where type_id = :vtyp


SQL> r
  1  select SQL_ID, EXECUTIONS, HASH_VALUE, OLD_HASH_VALUE, PLAN_HASH_VALUE, CHILD_NUMBER, REMOTE,
  2  LAST_ACTIVE_TIME, BIND_DATA, LAST_LOAD_TIME, IS_OBSOLETE,IS_BIND_SENSITIVE, IS_BIND_AWARE, IS_SHAREABLE
  3  from v$sql where sql_id= 'ck03fdksfnrtw'
  4*
 
SQL_ID        EXECUTIONS HASH_VALUE OLD_HASH_VALUE PLAN_HASH_VALUE CHILD_NUMBER R LAST_ACTIVE_TIME
------------- ---------- ---------- -------------- --------------- ------------ - --------------------
BIND_DATA                                LAST_LOAD_TIME             I I I I
----------------------------------------     --------------------   - - - -                                                         
ck03fdksfnrtw          2 2968149820      847886462       599033881            0 N 26-FEB-2013:18:10:55
BEDA0B200100512C8A2F000101C0021602C102   2013-02-26/10:50:01    N Y N Y
 
ck03fdksfnrtw          4 2968149820      847886462        46243151            1 N 26-FEB-2013:18:15:19
BEDA0B200100512C8AA5000101C002160180            2013-02-26/18:12:53    N Y N N
 
ck03fdksfnrtw          2 2968149820      847886462       599033881            2 N 26-FEB-2013:18:16:46
BEDA0B200100512C8B37000101C0021602C102   2013-02-26/18:15:18    N Y Y Y
 
ck03fdksfnrtw          1 2968149820      847886462        46243151            3 N 26-FEB-2013:18:16:27
BEDA0B200100512C8B53000101C0021602C104   2013-02-26/18:15:46    N Y Y N
 
ck03fdksfnrtw          3 2968149820      847886462        46243151            4 N 26-FEB-2013:18:18:41
BEDA0B200100512C8B7B000101C002160180            2013-02-26/18:16:27    N Y Y Y
 
SQL> select distinct t.CHILD_NUMBER,t.PLAN_HASH_VALUE, b.name BIND_NAME,  b.value_string BIND_STRING,
            b.LAST_CAPTURED, b.WAS_CAPTURED
     from  v$sql t , v$sql_bind_capture b
     where b.value_string is not null and t.sql_id= 'ck03fdksfnrtw'
       and t.sql_id=b.sql_id and t.CHILD_NUMBER = b.CHILD_NUMBER order by b.LAST_CAPTURED;
 
CHILD_NUMBER PLAN_HASH_VALUE BIND_NAME        BIND_STRING            LAST_CAPTURED        WAS
------------ --------------- -------------      ---------------     -------------------- ---
           0       599033881 :VTYP                     1      26-FEB-2013:18:10:55 YES
           1        46243151 :VTYP                     0      26-FEB-2013:18:12:53 YES
           2       599033881 :VTYP                     1      26-FEB-2013:18:15:19 YES
           3        46243151 :VTYP                     3      26-FEB-2013:18:15:47 YES
           4        46243151 :VTYP                     0      26-FEB-2013:18:16:27 YES
 

In ORACLE 11G, new view be created for store “validate” plan selectivity for the execution plans.

SQL> select  hash_value, sql_id, child_number, range_id, low, high, predicate
   from  v$sql_cs_selectivity
    where sql_id='ck03fdksfnrtw';
 
HASH_VALUE SQL_ID        CHILD_NUMBER   RANGE_ID LOW        HIGH       PREDICATE
---------- ------------- ------------ ---------- ---------- ---------- ------------------------------
2968149820 ck03fdksfnrtw            4          0 0.000006   0.000014   =VTYP
2968149820 ck03fdksfnrtw            3          0 0.000006   0.000007   =VTYP
2968149820 ck03fdksfnrtw            2          0 0.899988   1.099986   =VTYP
 

Another new view store the histogram for execution times, and each version/child has three buckets

SQL> select hash_value, sql_id, child_number, bucket_id, count
     from  v$sql_cs_histogram
     where sql_id='ck03fdksfnrtw';
  2    3
HASH_VALUE SQL_ID        CHILD_NUMBER  BUCKET_ID      COUNT
---------- ------------- ------------ ---------- ----------
2968149820 ck03fdksfnrtw            4          0          3
2968149820 ck03fdksfnrtw            4          1          0
2968149820 ck03fdksfnrtw            4          2          0
 
2968149820 ck03fdksfnrtw            3          0          1
2968149820 ck03fdksfnrtw            3          1          0
2968149820 ck03fdksfnrtw            3          2          0
 
2968149820 ck03fdksfnrtw            2          0          0
2968149820 ck03fdksfnrtw            2          1          0
2968149820 ck03fdksfnrtw            2          2          2
 
2968149820 ck03fdksfnrtw            1          0          3
2968149820 ck03fdksfnrtw            1          1          0
2968149820 ck03fdksfnrtw            1          2          1
 
2968149820 ck03fdksfnrtw            0          0          1
2968149820 ck03fdksfnrtw            0          1          0
2968149820 ck03fdksfnrtw            0          2          1
 
15 rows selected.

ORACLE 11g also store the running time resource usage statistics such as return rows, buffer usage CPU in the view

SQL> select hash_value, sql_id, child_number, bind_set_hash_value, peeked, executions, rows_processed, buffer_gets, cpu_time
from v$sql_cs_statistics
where sql_id='ck03fdksfnrtw';  2    3
 
HASH_VALUE SQL_ID        CHILD_NUMBER BIND_SET_HASH_VALUE P EXECUTIONS ROWS_PROCESSED BUFFER_GETS   CPU_TIME
---------- ------------- ------------ ------------------- - ---------- -------------- ----------- ----------
2968149820 ck03fdksfnrtw            4          1475158189 Y          1             33          19          0
2968149820 ck03fdksfnrtw            3          2706503459 Y          1              1           3          0
2968149820 ck03fdksfnrtw            2          2342552567 Y          1        1281185        9087          0
2968149820 ck03fdksfnrtw            1          1475158189 Y          1             33          19          0
2968149820 ck03fdksfnrtw            0          1475158189 Y          1             17        9087          0

ORACLE 11G has owe rule to set SQL as “SENSITIVE”, ORACLE 11g only manage those SQL marked as “SENSITIVE” bind variable as above.


Appendix  ---  Test case on ORACLE 10G for stewed data and Bind variable peeking 
 alter system set "_optimizer_invalidation_period" = 60 scope=memory;
 SQL> var vdate number;
SQL> exec :vdate := 20;
 
PL/SQL procedure successfully completed.
 
SQL> select max(object_id), min(object_id) from pt1 where created > sysdate - :vdate;
 
MAX(OBJECT_ID) MIN(OBJECT_ID)
-------------- --------------
         46478              2
 
SQL> select SQL_ID, EXECUTIONS, HASH_VALUE, OLD_HASH_VALUE, PLAN_HASH_VALUE, CHILD_NUMBER, REMOTE,    
            LAST_ACTIVE_TIME, BIND_DATA, LAST_LOAD_TIME, IS_OBSOLETE
     from v$sql where sql_id='bbjqg2f62vz6z';
 
SQL_ID        EXECUTIONS HASH_VALUE OLD_HASH_VALUE PLAN_HASH_VALUE CHILD_NUMBER R LAST_ACTIVE_TIME
------------- ---------- ---------- -------------- --------------- ------------ - --------------------
BIND_DATA                                LAST_LOAD_TIME             I      
-----------------------------------------    --------------------- - 
bbjqg2f62vz6z          1 2351824095     3130352737      3347831050            0 N 01-FEB-2013:18:26:59
BEDA0A200300510B9873000101C0021602C115   2013-02-01/18:27:00   N
 
 
SQL> select distinct t.sql_id, t.sql_text SQL_TEXT,  t.PLAN_HASH_VALUE, b.name BIND_NAME,  
            b.value_string  BIND_STRING, b.LAST_CAPTURED, b.WAS_CAPTURED, , b.CHILD_NUMBER
      from  v$sql t , v$sql_bind_capture b
      where b.value_string is not null and t.sql_id='bbjqg2f62vz6z' and 
            t.sql_id = b.sql_id and t.CHILD_NUMBER = b.CHILD_NUMBER
 
SQL_ID        SQL_TEXT
------------- ------------------------------------------------------------------------------------------
PLAN_HASH_VALUE BIND_NAME         BIND_STRING                LAST_CAPTURED        WAS  CHILD_NUMBER
--------------- ---------------      --------------------------      -------------------- ---  ------------
bbjqg2f62vz6z select max(object_id), min(object_id) from pt1 where created > sysdate - :vdate
     3347831050 :VDATE                   20                         01-FEB-2013:18:26:59 YES   0


SQL> exec :vdate := 200;
 
PL/SQL procedure successfully completed.
 
SQL> select max(object_id), min(object_id) from pt1 where created > sysdate - :vdate;
 
MAX(OBJECT_ID) MIN(OBJECT_ID)
-------------- --------------
         46479              2
 
SQL> select SQL_ID, EXECUTIONS, HASH_VALUE, OLD_HASH_VALUE, PLAN_HASH_VALUE, CHILD_NUMBER, REMOTE,    
            LAST_ACTIVE_TIME, BIND_DATA, LAST_LOAD_TIME, IS_OBSOLETE
     from v$sql where sql_id='bbjqg2f62vz6z';
 
SQL_ID        EXECUTIONS HASH_VALUE OLD_HASH_VALUE PLAN_HASH_VALUE CHILD_NUMBER R LAST_ACTIVE_TIME
------------- ---------- ---------- -------------- --------------- ------------ - --------------------
BIND_DATA                                LAST_LOAD_TIME             I      
-----------------------------------------    --------------------- - 
bbjqg2f62vz6z          2 2351824095     3130352737      3347831050            0 N 01-FEB-2013:18:30:47
BEDA0A200300510B9873000101C0021602C115   2013-02-01/18:27:00   N
 
 
SQL> select distinct t.sql_id, t.sql_text SQL_TEXT,  t.PLAN_HASH_VALUE, b.name BIND_NAME,  
            b.value_string  BIND_STRING, b.LAST_CAPTURED, b.WAS_CAPTURED, , b.CHILD_NUMBER
      from  v$sql t , v$sql_bind_capture b
      where b.value_string is not null and t.sql_id='bbjqg2f62vz6z' and 
            t.sql_id = b.sql_id and t.CHILD_NUMBER = b.CHILD_NUMBER
 
SQL_ID        SQL_TEXT
------------- ------------------------------------------------------------------------------------------
PLAN_HASH_VALUE BIND_NAME         BIND_STRING                LAST_CAPTURED        WAS  CHILD_NUMBER
--------------- ---------------      --------------------------      -------------------- ---  ------------
bbjqg2f62vz6z select max(object_id), min(object_id) from pt1 where created > sysdate - :vdate
     3347831050 :VDATE                   200                        01-FEB-2013:18:30:47 YES   0
 
 
SQL> exec dbms_stats.gather_table_stats('SCOTT','PT1');  /* Make cursor plan in cache invalid */
 
PL/SQL procedure successfully completed.
SQL> r
  1* select max(object_id), min(object_id) from pt1 where created > sysdate - :vdate
 
MAX(OBJECT_ID) MIN(OBJECT_ID)
-------------- --------------
         46479              2
 
SQL> select SQL_ID, EXECUTIONS, HASH_VALUE, OLD_HASH_VALUE, PLAN_HASH_VALUE, CHILD_NUMBER, REMOTE,    
            LAST_ACTIVE_TIME, BIND_DATA, LAST_LOAD_TIME, IS_OBSOLETE
     from v$sql where sql_id='bbjqg2f62vz6z';
 
SQL_ID        EXECUTIONS HASH_VALUE OLD_HASH_VALUE PLAN_HASH_VALUE CHILD_NUMBER R LAST_ACTIVE_TIME
------------- ---------- ---------- -------------- --------------- ------------ - --------------------
BIND_DATA                                LAST_LOAD_TIME             I      
-----------------------------------------    --------------------- - 
bbjqg2f62vz6z          3 2351824095     3130352737      3347831050            0 N 01-FEB-2013:18:33:38
BEDA0A200300510B9873000101C0021602C115   2013-02-01/18:27:00   N
 
 
SQL> select distinct t.sql_id, t.sql_text SQL_TEXT,  t.PLAN_HASH_VALUE, b.name BIND_NAME,  
            b.value_string  BIND_STRING, b.LAST_CAPTURED, b.WAS_CAPTURED, , b.CHILD_NUMBER
      from  v$sql t , v$sql_bind_capture b
      where b.value_string is not null and t.sql_id='bbjqg2f62vz6z' and 
            t.sql_id = b.sql_id and t.CHILD_NUMBER = b.CHILD_NUMBER
 
SQL_ID        SQL_TEXT
------------- ------------------------------------------------------------------------------------------
PLAN_HASH_VALUE BIND_NAME         BIND_STRING                LAST_CAPTURED        WAS  CHILD_NUMBER
--------------- ---------------      --------------------------      -------------------- ---  ------------
bbjqg2f62vz6z select max(object_id), min(object_id) from pt1 where created > sysdate - :vdate
     3347831050 :VDATE                   200                        01-FEB-2013:18:33:35 YES  0
 
SQL> r
  1* select max(object_id), min(object_id) from pt1 where created > sysdate - :vdate
 
MAX(OBJECT_ID) MIN(OBJECT_ID)
-------------- --------------
         46479              2
 
SQL> select SQL_ID, EXECUTIONS, HASH_VALUE, OLD_HASH_VALUE, PLAN_HASH_VALUE, CHILD_NUMBER, REMOTE,    
            LAST_ACTIVE_TIME, BIND_DATA, LAST_LOAD_TIME, IS_OBSOLETE
     from v$sql where sql_id='bbjqg2f62vz6z';
 
SQL_ID        EXECUTIONS HASH_VALUE OLD_HASH_VALUE PLAN_HASH_VALUE CHILD_NUMBER R LAST_ACTIVE_TIME
------------- ---------- ---------- -------------- --------------- ------------ - --------------------
BIND_DATA                                LAST_LOAD_TIME             I      
-----------------------------------------    --------------------- - 
bbjqg2f62vz6z          3 2351824095     3130352737      3347831050            0 N 01-FEB-2013:18:33:38
BEDA0A200300510B9873000101C0021602C115   2013-02-01/18:27:00   N
 
bbjqg2f62vz6z          1 2351824095     3130352737      3347831050            1 N 01-FEB-2013:18:34:59
BEDA0A200300510B9A53000101C0021602C203   2013-02-01/18:35:01   N
 
 
SQL> select distinct t.sql_id, t.sql_text SQL_TEXT,  t.PLAN_HASH_VALUE, b.name BIND_NAME,  
            b.value_string  BIND_STRING, b.LAST_CAPTURED, b.WAS_CAPTURED, , b.CHILD_NUMBER
      from  v$sql t , v$sql_bind_capture b
      where b.value_string is not null and t.sql_id='bbjqg2f62vz6z' and 
            t.sql_id = b.sql_id and t.CHILD_NUMBER = b.CHILD_NUMBER
 
SQL_ID        SQL_TEXT
------------- ------------------------------------------------------------------------------------------
PLAN_HASH_VALUE BIND_NAME         BIND_STRING                LAST_CAPTURED        WAS  CHILD_NUMBER
--------------- ---------------      --------------------------      -------------------- ---  ------------
bbjqg2f62vz6z select max(object_id), min(object_id) from pt1 where created > sysdate - :vdate
     3347831050 :VDATE                   200                        01-FEB-2013:18:34:59 YES   1
 
bbjqg2f62vz6z select max(object_id), min(object_id) from pt1 where created > sysdate - :vdate
     3347831050 :VDATE                   20                         01-FEB-2013:18:33:35 YES    0


Bind variable peeking in 10G and 11G

SQL ID with bind variable, when generate or refresh the execution plan, it would use the captured value of bind variable, this captured value of bind variables link to the SQL ID. Even value of bind variable value had been changed when execution plan be generated, it still look back to the captured value of bind variables. And the captured value of bind variable is controlled by  “_cursor_bind_capture_interval” (900 seconds as default )  and re-capture triggered if the last capture time for the SQL ID is “_cursor_bind_capture_interval” .

 Find out the value of captured bind variable :

========== Execute plan with Bind variable in 10g/11g ======================

SQL> select distinct sql_id,  t.sql_text SQL_TEXT,  t.PLAN_HASH_VALUE, b.name BIND_NAME,  b.value_string BIND_STRING, b.LAST_CAPTURED, b.WAS_CAPTURED
  2   from  v$sql t  join v$sql_bind_capture b  using (sql_id)
  3   where b.value_string is not null and sql_id='4k29quznbg6pa';

SQL_ID        SQL_TEXT                                          PLAN_HASH_VALUE  BIND_NAME
------------- ---------------------------------------------------   ---------------  ------------
BIND_STRING          LAST_CAPTURED        WAS
-------------------   ----------------      --------
4k29quznbg6pa select * from pt1 where created > sysdate - :vdate            1267018005 :VDATE
800                  23-JAN-2013:14:39:54  YES

=== changed :vdate value and captured after _ cursor_bind_capture_interval ==========


SQL> r
  1  select distinct sql_id,  t.sql_text SQL_TEXT,  t.PLAN_HASH_VALUE, b.name BIND_NAME,  b.value_string BIND_STRING, b.LAST_CAPTURED, b.WAS_CAPTURED
    from  v$sql t  join v$sql_bind_capture b  using (sql_id)
 where b.value_string is not null and sql_id='4k29quznbg6pa'
 
SQL_ID        SQL_TEXT                                          PLAN_HASH_VALUE  BIND_NAME
------------- ---------------------------------------------------   ---------------  ------------
BIND_STRING          LAST_CAPTURED        WAS
-------------------   ----------------      --------
4k29quznbg6pa select * from pt1 where created > sysdate - :vdate            1267018005 :VDATE
900                  23-JAN-2013:15:08:51 YES 

 In ORACLE 10G, for ALL bind variables in “where” clause with ANY operator on the column(s), current captured bind variables would not trigger the new execution plan or plan switch even value(s) had been changed  and existing execution plan might not be optimized. Execution plan switching or re-gen  only control by “invalidation interval” as described above.  Below examples is to show no dependency on the captured value and execution plan.

 === Can find bind data in v$SQL also, but in binary format =====

=== Make two diff SQL ID with add <space> in front, to find out how the existing plan changes ===

 SQL> r

  1  select SQL_ID, OBJECT_STATUS, IS_OBSOLETE, FIRST_LOAD_TIME, LAST_LOAD_TIME, LAST_ACTIVE_TIME, BIND_DATA, PLAN_HASH_VALUE  from v$sql
  2* where sql_id in ('4k29quznbg6pa','50msx60hgkxjt')
 
SQL_ID        OBJECT_STATUS       I FIRST_LOAD_TIME       LAST_LOAD_TIME        LAST_ACTIVE_TIME
------------- ------------------- - ----------------      --------------------  --------------------- 
BIND_DATA                                             PLAN_HASH_VALUE      
--------------------------------------------------------   ----------------  
50msx60hgkxjt VALID               N 2013-01-23/12:11:01   2013-01-23/12:11:01   23-JAN-2013:15:05:54                                                    
BEDA0A20030050FF8BCC000101C0021602C20A                2821530121     
 
4k29quznbg6pa VALID               N 2013-01-23/14:39:56   2013-01-23/14:39:56   23-JAN-2013:15:08:54                                                       
BEDA0A20030050FF8C83000101C0021602C20A                1267018005


SQL> select * from table(dbms_xplan.display_cursor('50msx60hgkxjt',null,'advanced'));
 PLAN_TABLE_OUTPUT
-------------------------------------------------------------------------------------------------------------
SQL_ID  50msx60hgkxjt, child number 0
-------------------------------------
select * from pt1 where created > sysdate - :vdate
 
Plan hash value: 2821530121
 
----------------------------------------------------------------------------------------
| Id  | Operation                   | Name     | Rows  | Bytes | Cost (%CPU)| Time     |
----------------------------------------------------------------------------------------
|   0 | SELECT STATEMENT            |          |       |       |     3 (100)|          |
|   1 |  TABLE ACCESS BY INDEX ROWID| PT1      |     1 |    93 |     3   (0)| 00:00:01 |
|*  2 |   INDEX RANGE SCAN          | PT1_IDX1 |     1 |       |     2   (0)| 00:00:01 |
----------------------------------------------------------------------------------------
 
Query Block Name / Object Alias (identified by operation id):
-------------------------------------------------------------
 
   1 - SEL$1 / PT1@SEL$1
   2 - SEL$1 / PT1@SEL$1
 
Outline Data
-------------
 
  /*+
      BEGIN_OUTLINE_DATA
      IGNORE_OPTIM_EMBEDDED_HINTS
      OPTIMIZER_FEATURES_ENABLE('10.2.0.3')
      OPT_PARAM('_complex_view_merging' 'false')
      OPT_PARAM('star_transformation_enabled' 'true')
      ALL_ROWS
      OUTLINE_LEAF(@"SEL$1")
      INDEX_RS_ASC(@"SEL$1" "PT1"@"SEL$1" ("PT1"."CREATED"))
      END_OUTLINE_DATA
  */
 
Peeked Binds (identified by position):
--------------------------------------
   1 - :VDATE (NUMBER): 10
Predicate Information (identified by operation id):
---------------------------------------------------
 
   2 - access("CREATED">SYSDATE@!-:VDATE)
 
Column Projection Information (identified by operation id):
-----------------------------------------------------------
 
   1 - "PT1"."OWNER"[VARCHAR2,30], "PT1"."OBJECT_NAME"[VARCHAR2,128],
       "PT1"."SUBOBJECT_NAME"[VARCHAR2,30], "PT1"."OBJECT_ID"[NUMBER,22],
       "PT1"."DATA_OBJECT_ID"[NUMBER,22], "PT1"."OBJECT_TYPE"[VARCHAR2,19],
       "CREATED"[DATE,7], "PT1"."LAST_DDL_TIME"[DATE,7],
       "PT1"."TIMESTAMP"[VARCHAR2,19], "PT1"."STATUS"[VARCHAR2,7],
       "PT1"."TEMPORARY"[VARCHAR2,1], "PT1"."GENERATED"[VARCHAR2,1],
       "PT1"."SECONDARY"[VARCHAR2,1]
   2 - "PT1".ROWID[ROWID,10], "CREATED"[DATE,7]
 
 
57 rows selected.
 
SQL> r
  1* select * from table(dbms_xplan.display_cursor('4k29quznbg6pa',null,'advanced'))
 
PLAN_TABLE_OUTPUT
-------------------------------------------------------------------------------------------------------------
SQL_ID  4k29quznbg6pa, child number 0
-------------------------------------
 select * from pt1 where created > sysdate - :vdate
 
Plan hash value: 1267018005
 
--------------------------------------------------------------------------
| Id  | Operation         | Name | Rows  | Bytes | Cost (%CPU)| Time     |
--------------------------------------------------------------------------
|   0 | SELECT STATEMENT  |      |       |       |   129 (100)|          |
|*  1 |  TABLE ACCESS FULL| PT1  | 45031 |  4089K|   129   (4)| 00:00:02 |
--------------------------------------------------------------------------
 
Query Block Name / Object Alias (identified by operation id):
-------------------------------------------------------------
 
   1 - SEL$1 / PT1@SEL$1
 
Outline Data
-------------
 
  /*+
      BEGIN_OUTLINE_DATA
      IGNORE_OPTIM_EMBEDDED_HINTS
      OPTIMIZER_FEATURES_ENABLE('10.2.0.3')
      OPT_PARAM('_complex_view_merging' 'false')
      OPT_PARAM('star_transformation_enabled' 'true')
      ALL_ROWS
      OUTLINE_LEAF(@"SEL$1")
      FULL(@"SEL$1" "PT1"@"SEL$1")
      END_OUTLINE_DATA
  */
 
Peeked Binds (identified by position):
--------------------------------------
 
   1 - :VDATE (NUMBER): 800
 
Predicate Information (identified by operation id):
---------------------------------------------------
 
   1 - filter("CREATED">SYSDATE@!-:VDATE)
 
Column Projection Information (identified by operation id):
-----------------------------------------------------------
 
   1 - "PT1"."OWNER"[VARCHAR2,30], "PT1"."OBJECT_NAME"[VARCHAR2,128],
       "PT1"."SUBOBJECT_NAME"[VARCHAR2,30], "PT1"."OBJECT_ID"[NUMBER,22],
       "PT1"."DATA_OBJECT_ID"[NUMBER,22], "PT1"."OBJECT_TYPE"[VARCHAR2,19],
       "CREATED"[DATE,7], "PT1"."LAST_DDL_TIME"[DATE,7],
       "PT1"."TIMESTAMP"[VARCHAR2,19], "PT1"."STATUS"[VARCHAR2,7],
       "PT1"."TEMPORARY"[VARCHAR2,1], "PT1"."GENERATED"[VARCHAR2,1],
       "PT1"."SECONDARY"[VARCHAR2,1]
 
 
54 rows selected.

In 10G, after object statistics gathering, when SQL re-run after “invalid interval”, SQL plan would switch to existing plan first and final generate the new version of plan (may just duplicated from history). All the bind variable peeking value in history plan would be updated to currently even execution plan actually generated using old peeking value.

============== bind peeking in 10G with statistics re-gathering =========

   1  select SQL_ID, EXECUTIONS, HASH_VALUE, PLAN_HASH_VALUE, CHILD_NUMBER, REMOTE, LAST_ACTIVE_TIME, BIND_DATA, LAST_LOAD_TIME, IS_OBSOLETE

  2* from v$sql where sql_id ='276x596m9384u'
  3  ;
 
SQL_ID        EXECUTIONS HASH_VALUE PLAN_HASH_VALUE CHILD_NUMBER R LAST_ACTIVE_TIME     
------------- ---------- ---------- --------------- ------------ - -------------------- 
BIND_DATA                                LAST_LOAD_TIME       I
---------------------------------------- -------------------- -
276x596m9384u         10 2794561690      2734209795            0 N 15-FEB-2013:16:04:27 
BEDA0A200300511DEC0B000101C0021602C102   2013-02-15/11:04:29  N
276x596m9384u         10 2794561690      3214516708            1 N 15-FEB-2013:16:05:51 
BEDA0A200300511DEC5E000101C0021602C102   2013-02-15/11:23:59  N
276x596m9384u          6 2794561690      2734209795            2 N 15-FEB-2013:16:15:36 
BEDA0A200300511DEEA8000101C0021602C102   2013-02-15/11:57:05  N
276x596m9384u          9 2794561690      3214516708            3 N 15-FEB-2013:16:13:42 
BEDA0A200300511DEE36000101C0021602C102   2013-02-15/15:11:50  N
276x596m9384u          2 2794561690      2734209795            4 N 15-FEB-2013:16:09:06 
BEDA0A200300511DED22000101C0021602C102   2013-02-15/15:59:23  N
276x596m9384u          1 2794561690      3214516708            5 N 15-FEB-2013:17:46:38 
BEDA0A200300511E03FE000101C0021602C102   2013-02-15/17:46:39  N
 
6 rows selected.
 
r
  1  select distinct t.CHILD_NUMBER,t.PLAN_HASH_VALUE, b.name BIND_NAME,  b.value_string BIND_STRING, b.LAST_CAPTURED, b.WAS_CAPTURED
  2  from  v$sql t , v$sql_bind_capture b
  3  where b.value_string is not null and t.sql_id= '276x596m9384u'
  4*    and t.sql_id=b.sql_id and t.CHILD_NUMBER = b.CHILD_NUMBER order by b.LAST_CAPTURED
 
CHILD_NUMBER PLAN_HASH_VALUE BIND_NAME  BIND_STRIN LAST_CAPTURED        WAS
------------ --------------- ---------- ---------- -------------------- ---
           0      2734209795 :VID       1          15-FEB-2013:16:04:27 YES
           1      3214516708 :VID       1          15-FEB-2013:16:05:50 YES
           4      2734209795 :VID       1          15-FEB-2013:16:09:06 YES
           3      3214516708 :VID       1          15-FEB-2013:16:13:42 YES
           2      2734209795 :VID       1          15-FEB-2013:16:15:36 YES
           5      3214516708 :VID       1          15-FEB-2013:17:46:38 YES
 
6 rows selected.

 In 11G, Execution plan version processing had description as above, it would not loop back to existing versions/children plan in order to generate new version of plan. When bind variable peeking happens in 11G, 11G had improved the optimizer to handle this. It will identify whether such bind variable peeking is “sensitive” or not. If it is “sensitive”, Optimizer will check the current value of variables and compare with history of “peeking” values to pick up the correct plan or generate new plan. If bind variable is not “sensitive”, it will use last peeking value and execution plan until new version of plan handling be trigger, and at that time, the current value of bind variables will be used to generate new version of execution plan, and existing plan history would not be changed on the bind variables peeking value, the history of plan will remain the “peeking” values.

 Below is the case of  NOT sensitive “Bind Variable Peeking” in 11G (11.2.0.2), The execution plans will not switch or re-gen until trigger (statistics gathering)  for re-gen (not switching) happen.

 Change vtyp  value on the sequence 0, 1,2,0 , re-run the SQL after bind variable changed, and with gather statistics on the object_list, re-run SQL after “ invalid interval”

 Type_ID is the column with stewed data and histogram statistics. When column histogram statistics is not captured, then the execution plan will not changed by bind variable value changed and statistics re-gathered.  Repeated run below in one session , Check version and bind variable values.

 select max(object_id) from object_list where type_id = :vtyp –  1

 SQL> r
  1  select SQL_ID, EXECUTIONS, HASH_VALUE, OLD_HASH_VALUE, PLAN_HASH_VALUE, CHILD_NUMBER, REMOTE,
  2  LAST_ACTIVE_TIME, BIND_DATA, LAST_LOAD_TIME, IS_OBSOLETE,IS_BIND_SENSITIVE, IS_BIND_AWARE, IS_SHAREABLE
  3* from v$sql where sql_id='9nhany360wxs1'
 
SQL_ID        EXECUTIONS HASH_VALUE OLD_HASH_VALUE PLAN_HASH_VALUE CHILD_NUMBER R LAST_ACTIVE_TIME
------------- ---------- ---------- -------------- --------------- ------------ - --------------------
BIND_DATA                                LAST_LOAD_TIME                    I I I I
----------------------------------------     --------------------------    - - - -
9nhany360wxs1          2 3423500033     4199617170       599033881            0 N 26-FEB-2013:11:11:41
BEDA0B200100512C27EC000101C002160180            2013-02-26/10:48:39           N N N Y
 
9nhany360wxs1          4 3423500033     4199617170        46243151            1 N 26-FEB-2013:11:17:55
BEDA0B200100512C2801000101C0021602C102   2013-02-26/11:12:01           N N N Y
 
9nhany360wxs1          3 3423500033     4199617170        46243151            2 N 26-FEB-2013:11:30:26
BEDA0B200100512C2AA5000101C0021602C102   2013-02-26/11:23:16           N N N Y
 
9nhany360wxs1          3 3423500033     4199617170       599033881            3 N 26-FEB-2013:11:40:00
BEDA0B200100512C2D58000101C0021602C103   2013-02-26/11:34:49           N N N Y
 
9nhany360wxs1          1 3423500033     4199617170        46243151            4 N 26-FEB-2013:11:42:17
BEDA0B200100512C2F19000101C002160180            2013-02-26/11:42:17           N N N Y
 
 
SQL> select distinct t.CHILD_NUMBER,t.PLAN_HASH_VALUE, b.name BIND_NAME,  b.value_string BIND_STRING, b.LAST_CAPTURED, b.WAS_CAPTURED
  2  from  v$sql t , v$sql_bind_capture b
  3  where b.value_string is not null and t.sql_id= '9nhany360wxs1'
  4  and t.sql_id=b.sql_id and t.CHILD_NUMBER = b.CHILD_NUMBER order by b.LAST_CAPTURED;
 
CHILD_NUMBER PLAN_HASH_VALUE BIND_NAME   BIND_STRING          LAST_CAPTURED        WAS
------------ --------------- ------------       -------------------- -------------------- ---
           0       599033881 :VTYP       0                    26-FEB-2013:11:11:40 YES
           1        46243151 :VTYP       1                    26-FEB-2013:11:12:01 YES
           2        46243151 :VTYP       1                    26-FEB-2013:11:23:17 YES
           3       599033881 :VTYP       2                    26-FEB-2013:11:34:48 YES
           4        46243151 :VTYP       0                    26-FEB-2013:11:42:17 YES

Even  11G had improved on the bind peeking problem in 10G, but the limition for new imrovment still cause many problem special with histogram statistics.

Appendix   Test case on ORACLE 10G for stewed data and execution plan 
 
alter system set "_optimizer_invalidation_period" = 60 scope=memory;
 
SQL> r
  1* select max(object_id), min(object_id) from pt1 where created > sysdate - 20
MAX(OBJECT_ID) MIN(OBJECT_ID)
-------------- --------------
         46479             20
 
Pause 1 minute
 
SQL> r
  1* select max(object_id), min(object_id) from pt1 where created > sysdate - 20
 
MAX(OBJECT_ID) MIN(OBJECT_ID)
-------------- --------------
         46479             20
 
Pause 1 minute
 
SQL> r
  1* select max(object_id), min(object_id) from pt1 where created > sysdate - 20
 
MAX(OBJECT_ID) MIN(OBJECT_ID)
-------------- --------------
         46479             20
 
SQL> r
  1  select SQL_ID, EXECUTIONS, HASH_VALUE, PLAN_HASH_VALUE, CHILD_NUMBER, REMOTE, LAST_ACTIVE_TIME, LAST_LOAD_TIME, IS_OBSOLETE
  2* from v$sql where sql_id='9fx3nzvp2scyn'
 
SQL_ID        EXECUTIONS HASH_VALUE PLAN_HASH_VALUE CHILD_NUMBER R LAST_ACTIVE_TIME      LAST_LOAD_TIME            I
------------- ---------- ---------- --------------- ------------ - --------------------  ------------------        -
9fx3nzvp2scyn          5 3928765396      3347831050            0 N 01-FEB-2013:17:57:34  2013-02-01/17:42:04   N                        9fx3nzvp2scyn          3 3928765396      3347831050            1 N 01-FEB-2013:18:01:01  2013-02-01/17:46:34   N                                                       9fx3nzvp2scyn          2 3928765396      3347831050            2 N 01-FEB-2013:17:59:10  2013-02-01/17:54:35   N                                                  9fx3nzvp2scyn          1 3928765396      3347831050            3 N 01-FEB-2013:18:03:13  2013-02-01/18:03:14   N                                                         
 
Now, all the child plans are same, in this case using “index” since created>sysdate -20 only has 3 records
Update the table to exchange the histogram for each data point.
 
 
SQL> update pt1 set created = sysdate - 40 where created > sysdate - 20;
3 rows updated.

SQL> commit;
Commit complete.
 
SQL> update pt1 set created = sysdate -10 where created > sysdate - 40;
45028 rows updated.

SQL> commit;
exec dbms_stats.gather_table_stats('SCOTT','PT1');
 
The correct plan should be changed from “index scan” to full table scan since 45028 of 45031 records need be accessed, however, the correct execution plan only be generated after fifth call (each call pause for 1  minute) !!
 
SQL> r
  1* select max(object_id), min(object_id) from pt1 where created > sysdate - 20
MAX(OBJECT_ID) MIN(OBJECT_ID)
-------------- --------------
         46478              2
 
Pause 1 minute
 
SQL> r
  1* select max(object_id), min(object_id) from pt1 where created > sysdate - 20
 
MAX(OBJECT_ID) MIN(OBJECT_ID)
-------------- --------------
         46478              2
 
Pause 1 minute

SQL> r
  1* select max(object_id), min(object_id) from pt1 where created > sysdate - 20
 
MAX(OBJECT_ID) MIN(OBJECT_ID)
-------------- --------------
         46478              2
 
Pause 1 minute
 
SQL> r
  1* select max(object_id), min(object_id) from pt1 where created > sysdate - 20
 
MAX(OBJECT_ID) MIN(OBJECT_ID)
-------------- --------------
         46478              2
 
Pause 1 minute
 
SQL> r
  1* select max(object_id), min(object_id) from pt1 where created > sysdate - 20
 
MAX(OBJECT_ID) MIN(OBJECT_ID)
-------------- --------------
         46478              2
 
===== check execution plans history ===== 
SQL> r
  1  select SQL_ID, EXECUTIONS, HASH_VALUE, OLD_HASH_VALUE, PLAN_HASH_VALUE, CHILD_NUMBER, REMOTE, LAST_ACTIVE_TIME, BIND_DATA, LAST_LOAD_TIME, IS_OBSOLETE
  2* from v$sql where sql_id='9fx3nzvp2scyn'
 
SQL_ID        EXECUTIONS HASH_VALUE PLAN_HASH_VALUE CHILD_NUMBER R LAST_ACTIVE_TIME      LAST_LOAD_TIME   I
------------- ---------- ---------- --------------  ------------ - --------------------  -------------------   -
9fx3nzvp2scyn          6 3928765396      3347831050            0 N 01-FEB-2013:18:09:32  2013-02-01/17:42:04       N                                               
9fx3nzvp2scyn          4 3928765396      3347831050            1 N 01-FEB-2013:18:13:05  2013-02-01/17:46:34       N
9fx3nzvp2scyn          3 3928765396      3347831050            2 N 01-FEB-2013:18:16:02  2013-02-01/17:54:35       N
9fx3nzvp2scyn          2 3928765396      3347831050            3 N 01-FEB-2013:18:14:11  2013-02-01/18:03:14       N
9fx3nzvp2scyn          1 3928765396      3214516708            4 N 01-FEB-2013:18:17:44  2013-02-01/18:17:45       N
 

SQL execution plan in cache and objects statistics gathering

Before ORACLE 10G, object statistics gathering will immediately invalid all the underline execution plans in cache, plan re-generate will trigger when SQL be called again. After ORACLE 10G, underline parameter “_optimizer_invalidation_period” will control when the execution plan can be expired.

More frequency of object statistics gathering, more versions of SQL plan in cache. In 10G (tested in 10.2.0.3), Same plan may has diff version or child number of plan. Testing showed : For one SQL ID, any underline object statistics will trigger the optimizer re-gen the execution plan, and it was controlled by “_optimizer_invalidation_period”  with default value = 5 hours.

After object statistics gathering with no_validation = AUTO (default), when underline (affected) SQL be called, Optimizer will pick latest valid execution plan and run. If the running time exceed the “_optimizer_invalidation_period”  then after running the latest plan will be marked as “expired”.  In 11G, this “expired” plan will not be used in future (except plan had dependency on bind variable) ; in 10G, it will not be expired and just marked as “switch plan/re-gen plan” in next calling.

In 10G, execution plans in cache will be used at least once and new children (new version of plan) will be generated in final. Switching or Re-gen will happen after “_optimizer_invalidation_period” from last calling time if plan parse timing is before underline objects statistics gathering.

 In 11G, latest execution plans (need match to bind variable peeking value if have) will be call by default, and it will “marked” as “expired” if calling time exceed “_optimizer_invalidation_period” after object statistics gathering. New version of execution will be generated if re-run SQL after “_optimizer_invalidation_period” from “marked” “expired”.

If object statistics gathering with option no_validation = false, then underline execution plan(s) will flush out from cache. New plan will be re-gen in next time call.

Cases in below all tested on the columns with stewed values , and with histogram statistics.  In 10G, after statistics gathering, new or best optimized plan may need re-run query more than once (depended how many children in the cache for this SQL), and some old bad plan in cache will be call at least once before right plan be used !! In 10G, it may need extra handle to retire the SQL plan in cache more frequently  or config gathering statistics with no_validation = false (immediate invalidate plan after statistics be gathered).

In the tests, we changed the invalid period from 5 hours to 1 minute.

alter system set “_optimizer_invalidation_period” = 60 scope=memory

 And gather table statistics

exec dbms_stats.gather_table_stats('SCOTT','PT1',cascade=>true);

Then, re-run the following SQL until new child of execution plan be generated.

SQL> r
  1* select max(object_id), min(object_id) from pt1 where created > sysdate - 20

MAX(OBJECT_ID) MIN(OBJECT_ID)
-------------- --------------
         46479             20
 

During the each call, monitored the V$SQL for this SQL ID.

………………………………

In 10G, Repeated same SQL until new version generated, if re-call SQL with in 1 minute (“_optimizer_invalidation_period”), then plan would not switch.  If the data changes to diff histogram, and optimized plan should be “3214516708”, but each “3347831050” with diff child_number cached in shared pool would be used at least once (depend on how many times called during “_optimizer_invalidation_period”).  It would be worse off when bind variable peeking involved.  See appendix A for detail in ORACLE 10.2.0.3

SQL> r
  1  select SQL_ID, EXECUTIONS, HASH_VALUE, PLAN_HASH_VALUE, CHILD_NUMBER, REMOTE, LAST_ACTIVE_TIME, LAST_LOAD_TIME, IS_OBSOLETE
  2* from v$sql where sql_id='9fx3nzvp2scyn'
 
SQL_ID        EXECUTIONS HASH_VALUE PLAN_HASH_VALUE CHILD_NUMBER R LAST_ACTIVE_TIME      LAST_LOAD_TIME       I
------------- ---------- ---------- --------------- ------------ - --------------------  ------------------   -
9fx3nzvp2scyn          7 3928765396      3347831050            0 N 04-FEB-2013:17:47:11  2013-02-01/17:42:04  N
9fx3nzvp2scyn          7 3928765396      3347831050            1 N 04-FEB-2013:17:46:08  2013-02-01/17:46:34  N
9fx3nzvp2scyn          4 3928765396      3347831050            2 N 04-FEB-2013:17:45:11  2013-02-01/17:54:35  N
9fx3nzvp2scyn          3 3928765396      3347831050            3 N 04-FEB-2013:17:44:17  2013-02-01/18:03:14  N
9fx3nzvp2scyn          4 3928765396      3214516708            4 N 04-FEB-2013:17:41:32  2013-02-01/18:17:45  N
9fx3nzvp2scyn          6 3928765396      3347831050            5 N 05-FEB-2013:09:26:46  2013-02-04/17:48:58  N
 
6 rows selected.
 
== after 9 times calls , 3 times called with 1 minute == 
 
SQL> r
  1  select SQL_ID, EXECUTIONS, HASH_VALUE, PLAN_HASH_VALUE, CHILD_NUMBER, REMOTE, LAST_ACTIVE_TIME, LAST_LOAD_TIME, IS_OBSOLETE
  2* from v$sql where sql_id='9fx3nzvp2scyn'
 
SQL_ID        EXECUTIONS HASH_VALUE PLAN_HASH_VALUE CHILD_NUMBER R LAST_ACTIVE_TIME      LAST_LOAD_TIME       I
------------- ---------- ---------- --------------- ------------ - --------------------  ------------------   -
9fx3nzvp2scyn          8 3928765396      3347831050            0 N 05-FEB-2013:09:46:29  2013-02-01/17:42:04  N
9fx3nzvp2scyn         10 3928765396      3347831050            1 N 05-FEB-2013:09:40:41  2013-02-01/17:46:34  N
9fx3nzvp2scyn          5 3928765396      3347831050            2 N 05-FEB-2013:09:39:32  2013-02-01/17:54:35  N
9fx3nzvp2scyn          4 3928765396      3347831050            3 N 05-FEB-2013:09:37:04  2013-02-01/18:03:14  N
9fx3nzvp2scyn          5 3928765396      3214516708            4 N 05-FEB-2013:09:35:01  2013-02-01/18:17:45  N
9fx3nzvp2scyn          7 3928765396      3347831050            5 N 05-FEB-2013:09:48:47  2013-02-04/17:48:58  N
9fx3nzvp2scyn          1 3928765396      3214516708            6 N 05-FEB-2013:09:49:50  2013-02-05/09:49:51  N
 

7 rows selected.

 In 11G, no loop on the older version of execution plan, and It had improved on the bind variable peeking too. The LAST_ACTIVE_TIME  in 11G always happened before LAST_LOAD_TIME of next version.

 SQL> r

  1  select SQL_ID, EXECUTIONS, HASH_VALUE, PLAN_HASH_VALUE, CHILD_NUMBER, REMOTE, LAST_ACTIVE_TIME, LAST_LOAD_TIME, IS_OBSOLETE
  2* from v$sql where sql_id='1s1033aqhf1q4'
 
SQL_ID        EXECUTIONS HASH_VALUE PLAN_HASH_VALUE CHILD_NUMBER R LAST_ACTIVE_TIME      LAST_LOAD_TIME         I
------------- ---------- ---------- --------------- ------------ - --------------------  -------------------    -
1s1033aqhf1q4          4 2902918852       599033881            0 N 05-FEB-2013:16:42:06  2013-02-05/16:39:47    N
1s1033aqhf1q4          3 2902918852       599033881            1 N 05-FEB-2013:17:08:16  2013-02-05/16:43:57    N
1s1033aqhf1q4          3 2902918852      3077296115            2 N 05-FEB-2013:17:20:05  2013-02-05/17:18:40    N


== after twice calls ==

SQL> r

  1  select SQL_ID, EXECUTIONS, HASH_VALUE, PLAN_HASH_VALUE, CHILD_NUMBER, REMOTE, LAST_ACTIVE_TIME, LAST_LOAD_TIME, IS_OBSOLETE

  2* from v$sql where sql_id=’1s1033aqhf1q4′

SQL_ID        EXECUTIONS HASH_VALUE PLAN_HASH_VALUE CHILD_NUMBER R LAST_ACTIVE_TIME      LAST_LOAD_TIME         I
------------- ---------- ---------- --------------- ------------ - --------------------  -------------------    -
1s1033aqhf1q4          4 2902918852       599033881            0 N 05-FEB-2013:16:42:06  2013-02-05/16:39:47    N
1s1033aqhf1q4          3 2902918852       599033881            1 N 05-FEB-2013:17:08:16  2013-02-05/16:43:57    N
1s1033aqhf1q4          4 2902918852      3077296115            2 N 05-FEB-2013:17:22:09  2013-02-05/17:18:40    N
1s1033aqhf1q4          1 2902918852      3077296115            3 N 05-FEB-2013:17:24:27  2013-02-05/17:24:26    N

So, When find execution plan changed due to the statistics idel, and manual gathering the statistics, if you do not invalidate the execution immediate, the new plan or correct plan may not be generated or re-use. In 10G, it even need goes thru every version of execution plan in invalidation period which default value is 5 hours, before create the new version plan.