DBMS_JOB interval defined as past time.

Once create the DBA_JOBS from DBMS_JOB, the next run would be base on the results from formula in interval field . What happen if the result from “interval” is fall in past ? Would the job stopped forever or tune to invalid ?

DBMS_JOB is an user submit job, when the job be triggered to run by backend job processes, it would set the next run time by job interval definition. This is why when job failed and suspend, even DBA resume the job back, without manual successfully runs the job to set the next running time, the job would running in future.

Bankend CJQn will pick the next run time after last CJQn to todate time, so if the job didn’t ran to reset next run time in future, then it would run in future until manual trigger the job to reset next run time again.

Interval partition on date type and between clause in where

When config the partition table for interval partitioning (auto allocate the new partition), if the partition key on the date type and query runs on the partition key, the interesting thing would be happened with date type column with between operation on max date value (31-DEC-9999), solution for this always only use MAX date value to 31-DEC-9998 for yearly interval.

TT1

CREATE TABLE “IDSAPPDBA”.”TT1″
( “ID” NUMBER,
“DESCRIPTION” VARCHAR2(50 BYTE),
“CREATED_DATE” DATE
) PCTFREE 10 PCTUSED 40 INITRANS 1 MAXTRANS 255
PARTITION BY RANGE (“CREATED_DATE”) INTERVAL (NUMTOYMINTERVAL(12,’MONTH’))

Partitions list :

PART_01 21-DEC-2016 22:01:43 0 0 TO_DATE(‘ 2005-01-01 00:00:00’, ‘SYYYY-MM-DD HH24:MI:SS’, ‘NLS_CALENDAR=GREGORIAN’)
SYS_P34333 21-DEC-2016 22:01:43 1 250 1 TO_DATE(‘ 2010-01-01 00:00:00’, ‘SYYYY-MM-DD HH24:MI:SS’, ‘NLS_CALENDAR=GREGORIAN’)
SYS_P34334 21-DEC-2016 22:01:44 1 250 1 TO_DATE(‘ 2011-01-01 00:00:00’, ‘SYYYY-MM-DD HH24:MI:SS’, ‘NLS_CALENDAR=GREGORIAN’)
SYS_P34335 21-DEC-2016 22:01:43 1 250 1 TO_DATE(‘ 9999-01-01 00:00:00’, ‘SYYYY-MM-DD HH24:MI:SS’, ‘NLS_CALENDAR=GREGORIAN’)
SYS_P34336 21-DEC-2016 22:01:43 1 250 1 TO_DATE(‘ 9991-01-01 00:00:00’, ‘SYYYY-MM-DD HH24:MI:SS’, ‘NLS_CALENDAR=GREGORIAN’)
SYS_P34337 21-DEC-2016 22:01:43 3 250 3 TO_DATE(‘ 9912-01-01 00:00:00’, ‘SYYYY-MM-DD HH24:MI:SS’, ‘NLS_CALENDAR=GREGORIAN’)\

select * from tt1 where CREATED_DATE < ’16-DEC-9999′;

ORA-01841: (full) year must be between -4713 and +9999, and not be 0
01841. 00000 – “(full) year must be between -4713 and +9999, and not be 0”
*Cause: Illegal year entered
*Action: Input year in the specified range
Error at Line: 1 Column: 40

select * from tt1 where CREATED_DATE < ’16-DEC-9998′;

ID DESCRIPTION CREATED_DATE
9 t1 01-DEC-2009 00:00:00
9 t1 01-DEC-2010 00:00:00
9 t1 01-DEC-9911 00:00:00
9 t1 01-DEC-9900 00:00:00
9 t1 01-DEC-8888 00:00:00
9 t1 01-DEC-9990 00:00:00
9 t1 01-DEC-9998 00:00:00

For annual base partition, the “9999” is not valid, but if change to daily partition, this problem whould happened.

alter table tt1 set interval (numtodsinterval(1,’DAY’));

select * from tt1 where CREATED_DATE <= ’31-DEC-9999′;

ID DESCRIPTION CREATED_DATE
9 t1 01-DEC-2009 00:00:00
9 t1 01-DEC-2010 00:00:00
9 t1 01-DEC-9911 00:00:00
9 t1 01-DEC-9900 00:00:00
9 t1 01-DEC-8888 00:00:00
9 t1 01-DEC-9990 00:00:00
9 t1 01-DEC-9998 00:00:00


Global Temp Table again (in 12C)

GTT in Oracle for a long time, from 11G, GTT can allocate the tablespace in order separate with schema default temp tablespace. To use diffs temp tablespace can avoid the fragments in the default temp tablespace. Mostly performance issue on the temp tablespace comes with sorting in default tablespace, and other sessions shared same temp tablespace.

However, the defined tablespace for GTT would not work when do the parallel DML/Direct Insert. This constraint still valid in 12C. Follow test (was done in 11g) showed when temp segment created on parallel DML would back to default session/user temp tablespace.

Create the GTT on tablespace TEMP_BB, and session default temp tablespace is TEMP.

SQL> select * from dba_temp_free_space;

TABLESPACE_NAME                     TABLESPACE_SIZE      ALLOCATED_SPACE           FREE_SPACE
------------------------------ -------------------- -------------------- --------------------
TEMP                                 80,530,636,800       80,494,985,216       80,522,248,192
TEMP_BB                                   2,088,960            1,040,384            1,048,576


SQL> truncate table gtt_tab;

Table truncated.

Elapsed: 00:00:00.01
SQL> set autotrace off
SQL> insert /*+ append enable_parallel_dml */ into gtt_tab select /*+ parallel */ * from pba_rnd;

200000000 rows created.

Elapsed: 00:00:15.53
SQL> commit;

Commit complete.
SQL> select * from dba_temp_free_space

TABLESPACE_NAME                     TABLESPACE_SIZE      ALLOCATED_SPACE           FREE_SPACE
------------------------------ -------------------- -------------------- --------------------
TEMP                                 80,530,636,800       80,494,985,216       71,106,035,712
TEMP_BB                                   2,088,960            1,040,384            1,048,576

So TEMP was used for store the whole GTT, and TEMP_BB no change.
Work around method is serial insert into GTT to create the segments first which would be in TEMP_BB, then delete all !! NOT TRUNCATE table (truncate table would drop all the segments as test case above). Then normal parallel DML on GTT table.

SQL> select * from dba_temp_free_space;

TABLESPACE_NAME                     TABLESPACE_SIZE      ALLOCATED_SPACE           FREE_SPACE
------------------------------ -------------------- -------------------- --------------------
TEMP                                 80,530,636,800       80,494,985,216       80,522,248,192
TEMP_BB                                   2,088,960            1,040,384            1,048,576


SQL> insert into gtt_tab select * from pba_rnd where rownum < 10; 9 rows created. SQL> commit;

Commit complete.

SQL> delete from gtt_tab;

9 rows deleted.

SQL> commit;

Commit complete.

SQL> set timing on
SQL> select 'this is insert into flash disk temp table' from dual;

'THISISINSERTINTOFLASHDISKTEMPTABLE'
-----------------------------------------
this is insert into flash disk temp table

Elapsed: 00:00:00.01
SQL> insert /*+ append enable_parallel_dml */ into gtt_tab select /*+ parallel */ * from pba_rnd;

200000000 rows created.

Elapsed: 00:00:31.43
SQL> commit;

Commit complete.
SQL> select * from dba_temp_free_space

TABLESPACE_NAME                     TABLESPACE_SIZE      ALLOCATED_SPACE           FREE_SPACE
------------------------------ -------------------- -------------------- --------------------
TEMP                                 80,530,636,800       80,494,985,216       80,522,248,192
TEMP_BB                               9,416,212,480        9,408,872,448            7,340,032

Parallel DML is needed for batch loading huge size of records to process; separate temp tablespace for GTT table is avoiding the I/O contention on TEMP tablespace which is used for user processes sorting and tables joining.

Exadata flash cache for temp tablespace/GTT.

In the new version of Exadata, cell server had increased the flash cache up to about 90TB for X2-8 full rack. So it make sense to allocate the flash cache as DISK to store the high I/O segment, and ORACLE has use the flash cache as redo as default.

This post to exam the performance with flash cache as GTT storage. In the post for the GTT defined tablespace showed work around for store the GTT in defined tablespace even need parallel DML /Direct load operations on the GTT.

To exam the performance of Exadata feature, one thing need to mention — after 11gR2, ORACLE had implemented the “WRITE BACK” instead of “WRITE THROUGH” as default. “WRITE BACK” would enable the write to capture into flash cache and return back to process if the flash cache write operation faster than disk. Once return to process, the transaction considered done, and I/O locks released anyway. “WRITE BACK” enable the segments go to flash cache before hard disk in most of case (exception is I/O on hard disk faster then flash cache). “WRITE BACK” seems change the picture for store the GTT or create the temp tablespace in flash cache.

Use the same GTT to do the same operations and same set of data but no “WORK AROUND” and GTT segment final located into the default temp tablespace and flash cache should not use in old exadata version.

GTT_TAB is the Global Temp table with the tablespace defined as temp_bb, and temp_bb was created on the flask cache disk. The testing on the parallel DML to load 200M records into GTT_TAB and query on the table after commit.

First one, parallel DML directly applied and ORACLE would allocate session default temp tablespace to it.

SQL> select * from dba_temp_free_space;

TABLESPACE_NAME                     TABLESPACE_SIZE      ALLOCATED_SPACE           FREE_SPACE
------------------------------ -------------------- -------------------- --------------------
TEMP                                 80,530,636,800       80,494,985,216       80,522,248,192
TEMP_BB                                   2,088,960            1,040,384            1,048,576

SQL> truncate table gtt_tab;
Table truncated.

SQL> select statistic#, value
  2   from v$mystat
  3   where statistic# in (select statistic# from v$statname where name = 'cell flash cache read hits');

STATISTIC#      VALUE
---------- ----------
      1133          7

Elapsed: 00:00:00.01
SQL> set autotrace off
SQL> insert /*+ append enable_parallel_dml */ into gtt_tab select /*+ parallel */ * from pba_rnd;
200000000 rows created.
Elapsed: 00:00:15.53
SQL> commit;
Commit complete.
Elapsed: 00:00:00.09

SQL> select statistic#, value
  2   from v$mystat
  3   where statistic# in (select statistic# from v$statname where name = 'cell flash cache read hits');

STATISTIC#      VALUE
---------- ----------
      1133      17408     ---   17401 -- flash cache read for pba_rnd

SQL> set autotrace traceonly explain statistics
SQL> select column_name, count(*) from gtt_tab group by column_name;
4100 rows selected.

Elapsed: 00:00:30.65

Execution Plan
----------------------------------------------------------
Plan hash value: 2288548961

--------------------------------------------------------------------------------------
| Id  | Operation                  | Name    | Rows  | Bytes | Cost (%CPU)| Time     |
--------------------------------------------------------------------------------------
|   0 | SELECT STATEMENT           |         |  4020 | 44220 | 24940  (44)| 00:00:01 |
|   1 |  HASH GROUP BY             |         |  4020 | 44220 | 24940  (44)| 00:00:01 |
|   2 |   TABLE ACCESS STORAGE FULL| GTT_TAB |   200M|  2098M| 15611  (11)| 00:00:01 |
--------------------------------------------------------------------------------------

Note
-----
   - Global temporary table session private statistics used

Statistics
----------------------------------------------------------
          1  recursive calls
         13  db block gets
    1149558  consistent gets
    1149440  physical reads
         84  redo size
      92323  bytes sent via SQL*Net to client
       3377  bytes received via SQL*Net from client
        275  SQL*Net roundtrips to/from client
          0  sorts (memory)
          0  sorts (disk)
       4100  rows processed

SQL> set autotrace off
SQL> select statistic#, value
  2   from v$mystat
  3   where statistic# in (select statistic# from v$statname where name = 'cell flash cache read hits');

STATISTIC#      VALUE
---------- ----------
      1133      17779    --- 17779 - 17408  = 371  read hits. 

SQL> set autotrace traceonly 
SQL> select column_name, count(*) from gtt_tab group by column_name;
4100 rows selected.

Elapsed: 00:00:20.15

SQL> set autotrace off
SQL> select statistic#, value
  2   from v$mystat
  3   where statistic# in (select statistic# from v$statname where name = 'cell flash cache read hits');

STATISTIC#      VALUE
---------- ----------
      1133      28731    ---  After first run , second hit flash hit  28731 - 17779 = 952 

SQL>  select * from dba_temp_free_space

TABLESPACE_NAME                     TABLESPACE_SIZE      ALLOCATED_SPACE           FREE_SPACE
------------------------------ -------------------- -------------------- --------------------
TEMP                                 80,530,636,800       80,494,985,216       71,106,035,712
TEMP_BB                                   2,088,960            1,040,384            1,048,576

When GTT be truncated, new segment would be created when next time insert, if parallel DML does insert, the session base default tablespace would be used. Two facts showed here, the tablespace been used is the TEMP — session default; and flash cache be used for query on the temp tables!! — remember THERE WAS WRITE BACK on cell flash cache. — The query statistics show the flash cache was taken effective on GTT with temp tablespace in DISK.

When the GTT managed to create in flash cache disk, the performance was expected much better which been proven by others testing. However, the result was not show this, and ORACLE simply contrast flash cache with flash cache disk to store the temp tablespace.


SQL> select * from dba_temp_free_space;

TABLESPACE_NAME                     TABLESPACE_SIZE      ALLOCATED_SPACE           FREE_SPACE
------------------------------ -------------------- -------------------- --------------------
TEMP                                 80,530,636,800       80,494,985,216       80,522,248,192
TEMP_BB                              18,824,028,160       18,815,639,552       18,821,939,200

SQL> insert into gtt_tab select * from pba_rnd where rownum < 10; 9 rows created. Elapsed: 00:00:00.02 SQL> delete from gtt_tab;

9 rows deleted.

Elapsed: 00:00:00.01
SQL> commit;
Commit complete.

Elapsed: 00:00:00.00

SQL> select statistic#, value
  2   from v$mystat
  3   where statistic# in (select statistic# from v$statname where name = 'cell flash cache read hits');

STATISTIC#      VALUE
---------- ----------
      1133      28734

SQL> insert /*+ append enable_parallel_dml */ into gtt_tab select /*+ parallel */ * from pba_rnd;

200000000 rows created.

Elapsed: 00:00:16.27

SQL> select statistic#, value
  2   from v$mystat
  3   where statistic# in (select statistic# from v$statname where name = 'cell flash cache read hits');

STATISTIC#      VALUE
---------- ----------
      1133      45844      ---  increase to 45844 - 28734 = 17110 = same as GTT on hard disk. 

SQL> set autotrace traceonly explain statistics
SQL> select column_name, count(*) from gtt_tab group by column_name;

4100 rows selected.

Elapsed: 00:00:30.90

Execution Plan
----------------------------------------------------------
Plan hash value: 2288548961

--------------------------------------------------------------------------------------
| Id  | Operation                  | Name    | Rows  | Bytes | Cost (%CPU)| Time     |
--------------------------------------------------------------------------------------
|   0 | SELECT STATEMENT           |         |  4020 | 44220 | 24926  (44)| 00:00:01 |
|   1 |  HASH GROUP BY             |         |  4020 | 44220 | 24926  (44)| 00:00:01 |
|   2 |   TABLE ACCESS STORAGE FULL| GTT_TAB |   200M|  2098M| 15598  (11)| 00:00:01 |
--------------------------------------------------------------------------------------

Note
-----
   - Global temporary table session private statistics used

Statistics
----------------------------------------------------------
          1  recursive calls
         13  db block gets
    1148623  consistent gets
    1148416  physical reads
        128  redo size
      92326  bytes sent via SQL*Net to client
       3377  bytes received via SQL*Net from client
        275  SQL*Net roundtrips to/from client
          0  sorts (memory)
          0  sorts (disk)
       4100  rows processed

SQL> select statistic#, value
  2   from v$mystat
  3   where statistic# in (select statistic# from v$statname where name = 'cell flash cache read hits');

STATISTIC#      VALUE
---------- ----------
      1133      45865   -- only 21 hits on the flash cache.

SQL> select column_name, count(*) from pba_rnd group by column_name;

4100 rows selected.

Elapsed: 00:00:30.09

Execution Plan
----------------------------------------------------------
Plan hash value: 913254133

--------------------------------------------------------------------------------------
| Id  | Operation                  | Name    | Rows  | Bytes | Cost (%CPU)| Time     |
--------------------------------------------------------------------------------------
|   0 | SELECT STATEMENT           |         |  4100 | 45100 | 24946  (44)| 00:00:01 |
|   1 |  HASH GROUP BY             |         |  4100 | 45100 | 24946  (44)| 00:00:01 |
|   2 |   TABLE ACCESS STORAGE FULL| PBA_RND |   200M|  2098M| 15618  (11)| 00:00:01 |
--------------------------------------------------------------------------------------

Statistics
----------------------------------------------------------
          1  recursive calls
          9  db block gets
    1148496  consistent gets
    1148377  physical reads
          0  redo size
      92320  bytes sent via SQL*Net to client
       3377  bytes received via SQL*Net from client
        275  SQL*Net roundtrips to/from client
          0  sorts (memory)
          0  sorts (disk)
       4100  rows processed

SQL> select statistic#, value
  2   from v$mystat
  3   where statistic# in (select statistic# from v$statname where name = 'cell flash cache read hits');

STATISTIC#      VALUE
---------- ----------
      1133      45865   -- 0 hit on flash disk for GTT on flash cache disk !!!

SQL>select * from dba_temp_free_space

TABLESPACE_NAME                     TABLESPACE_SIZE      ALLOCATED_SPACE           FREE_SPACE
------------------------------ -------------------- -------------------- --------------------
TEMP                                 80,530,636,800       80,494,985,216       80,522,248,192
TEMP_BB                              18,824,028,160       18,815,639,552        9,437,184,000

The Second test was applied the “work around ” to enforce the GTT on the flash cache disk. The insert performance almost same as GTT on hard disk, the reason behind is : WRITE BACK cache , not wait for disk I/O complete to commit.
The QUERY performance is interesting, GTT on flash cache wasn’t performance better than on Hard Disk, and even worse when second time ran. Statistics showed GTT on flash cache disk total not get any hit on cell flash cache, this is make sense for ORACLE manage the flash cache I/O load. With diff way to organize the segments, in flash cache disk, segments management still as other tablespace on hard disk with file head and data block, perhaps in flash cache, address mapping may in memory which faster than flash cache, this is question need be tested and proved.

From this test, put temp tablespace into flash cache disk and store GTT into this tablespace seems would not gain any performance on query.

ORACLE Exadata Storage index saved zero bytes

Exadata storage index be used for filter the data blocks scan at cell servers level, Only full segment scan would benefit from this feature, and it would show the multiplex blocks read, and once the single block wait event happened, it mean no storage index be used.
Storage index feature would be disabled when the upgrading/datapump on going. The database properties on TIMEZONE would show the “DATAPUMP..” status.
Follow the Metalink

Doc ID 1583297.1 "Exadata: RDS Performance Degrades when Database is in Timezone Upgrade Mode" 

To remove this, for 12C, there are CDB and PDB level, the containers in CDB should be clean this status after upgrading/migrating.
Once the container in CDB on this status, storage index would not be in use. And from AWR report Top wait event would be on

 cell single block physical read

And normal exadata wait on I/O should be :

cell smart table scan

For the session level, monitor the

select a.sid, a.statistic#, b.name, value from v$mystat a, v$statname b
where a.statistic#=b.statistic#
  and a.statistic# = 433;
       SID STATISTIC# NAME                                             VALUE                                                                                                                                                            
---------- ---------- --------------------------------------------------------------                                                                                                                                                    
      1055        433 cell physical IO bytes saved by storage index  31,244,869,632                       

If value always show ZERO, then mostly storage index in cell server is not function.
Performance troubleshooting on such issue would go more complex, first fact is SQL plan all are same without change and data volume no change. So draw down to AWR report and session level statistics to fig out the root cause.

Query Parallel mode and Dynamic statistics, who will be first ?

After ORACLE version 9, most data warehouse application request for query run on parallel mode, and server’s SMP provides con-current for all the slave from parallel query.

Parallel query is designed for high performance and resource intensive operation. From Oracle 11G above, the query running mode can be control by the parallel parameters – parallel_policy , AUTO;MANUAL; LIMIT — For parallel DOP, only diff is AUTO DOP or manual via parallel hint. Optimizer alos need estimate the running time to decide whether on parallel mode, once optimizer choice the parallel mode, it need decide the DOP, using hint (still subject to downgrade); using dynamic statistics(for even distributes the work load to child processes).

But question is, how optimizer estimate the running time ? need dynamic statistics first ? or only base on the statistics in dictionary ? Or dynamic statistics will be used to estimate the running time first, then to decide the workload distribution ?

When the column histogram existing, Optimizer will respect the statistics, and decide whether will be parallel mode or not, once parallel mode had been decided, optimizer would trigger dynamic statistics for parallel degree decide and data distribution method, but no feedback to from dynamic statistics until 11g (12c adaptive plan becomes one possible method).

SQL> select /*+  */ avg(last_ddl_time-to_date('01-OCT-2010')), avg(created-to_date('01-OCT-2010')), count(*) from  test2 where owner = 'USER3' and substr(object_type,1,1)='T';

AVG(LAST_DDL_TIME-TO_DATE('01-OCT-2010')) AVG(CREATED-TO_DATE('01-OCT-2010'))   COUNT(*)
----------------------------------------- ----------------------------------- ----------
0

Elapsed: 00:00:01.86

Execution Plan
----------------------------------------------------------
Plan hash value: 2571823673

------------------------------------------------------------------------------------------------------------------------
| Id  | Operation                      | Name     | Rows  | Bytes | Cost (%CPU)| Time     |    TQ  |IN-OUT| PQ Distrib |
------------------------------------------------------------------------------------------------------------------------
|   0 | SELECT STATEMENT               |          |     1 |    38 |  6572   (4)| 00:00:01 |        |   |               |
|   1 |  SORT AGGREGATE                |          |     1 |    38 |            |          |        |   |               |
|   2 |   PX COORDINATOR               |          |       |       |            |          |        |   |               |
|   3 |    PX SEND QC (RANDOM)         | :TQ10000 |     1 |    38 |            |          |  Q1,00 | P->S | QC (RAND)  |
|   4 |     SORT AGGREGATE             |          |     1 |    38 |            |          |  Q1,00 | PCWP |            |
|   5 |      PX BLOCK ITERATOR         |          |  9860 |   365K|  6572   (4)| 00:00:01 |  Q1,00 | PCWC |            |
|*  6 |       TABLE ACCESS STORAGE FULL| TEST2    |  9860 |   365K|  6572   (4)| 00:00:01 |  Q1,00 | PCWP |            |
------------------------------------------------------------------------------------------------------------------------

Predicate Information (identified by operation id):
---------------------------------------------------

6 - storage("OWNER"='USER3' AND SUBSTR("OBJECT_TYPE",1,1)='T')
filter("OWNER"='USER3' AND SUBSTR("OBJECT_TYPE",1,1)='T')

Note
-----
- dynamic sampling used for this statement (level=5)
- automatic DOP: Computed Degree of Parallelism is 3
Statistics
----------------------------------------------------------
57  recursive calls
4  db block gets
925708  consistent gets
922163  physical reads
5124  redo size
523  bytes sent via SQL*Net to client
360  bytes received via SQL*Net from client
2  SQL*Net roundtrips to/from client
8  sorts (memory)
0  sorts (disk)
1  rows processed

SQL> select /*+  */ avg(last_ddl_time-to_date('01-OCT-2010')), avg(created-to_date('01-OCT-2010')), count(*) from  test2 where owner = 'USER2' and substr(object_type,1,1)='T';

AVG(LAST_DDL_TIME-TO_DATE('01-OCT-2010')) AVG(CREATED-TO_DATE('01-OCT-2010'))   COUNT(*)
----------------------------------------- ----------------------------------- ----------
1291.74533                          1000.87406    1065024

Elapsed: 00:02:18.32

Execution Plan
----------------------------------------------------------
Plan hash value: 1204039106

---------------------------------------------------------------------------------------------
| Id  | Operation                    | Name         | Rows  | Bytes | Cost (%CPU)| Time     |
---------------------------------------------------------------------------------------------
|   0 | SELECT STATEMENT             |              |     1 |    38 |     5   (0)| 00:00:01 |
|   1 |  SORT AGGREGATE              |              |     1 |    38 |            |          |
|*  2 |   TABLE ACCESS BY INDEX ROWID| TEST2        |     1 |    38 |     5   (0)| 00:00:01 |
|*  3 |    INDEX RANGE SCAN          | INDEX1_TEST2 |    18 |       |     4   (0)| 00:00:01 |
---------------------------------------------------------------------------------------------

Predicate Information (identified by operation id):
---------------------------------------------------

2 - filter(SUBSTR("OBJECT_TYPE",1,1)='T')
3 - access("OWNER"='USER2')

Note
-----
- automatic DOP: Computed Degree of Parallelism is 1 because of parallel threshold
Statistics
----------------------------------------------------------
1  recursive calls
0  db block gets
243503  consistent gets
174660  physical reads
12152576  redo size
569  bytes sent via SQL*Net to client
360  bytes received via SQL*Net from client
2  SQL*Net roundtrips to/from client
0  sorts (memory)
0  sorts (disk)
1  rows processed


The data in table had been change, the column with histogram, however statistics not been gathered.  Dynamic statistics only on the combined columns level, not replace the selective of column for parallel degree.

If delete all the statistics, the optimizer has no choice need force dynamic sampling on column self to decide whether need parallel mode base on the threshold (default 10 second and can control by under line parameter ), and dynamic sample on join columns would used for parallel options to be decided.

SQL> alter system flush buffer_cache;

System altered.

Elapsed: 00:00:00.06
SQL> alter system flush shared_pool;

System altered.

Elapsed: 00:00:00.01
SQL> select /*+  */ avg(last_ddl_time-to_date('01-OCT-2010')), avg(created-to_date('01-OCT-2010')), count(*) from  test2 where owner = 'USER2' and substr(object_type,1,1)='T';

AVG(LAST_DDL_TIME-TO_DATE('01-OCT-2010')) AVG(CREATED-TO_DATE('01-OCT-2010'))   COUNT(*)
----------------------------------------- ----------------------------------- ----------
                               1291.74533                          1000.87406    1065024

Elapsed: 00:00:02.34

Execution Plan
----------------------------------------------------------
Plan hash value: 2571823673

------------------------------------------------------------------------------------------------------------------------
| Id  | Operation                      | Name     | Rows  | Bytes | Cost (%CPU)| Time     |    TQ  |IN-OUT| PQ Distrib |
------------------------------------------------------------------------------------------------------------------------
|   0 | SELECT STATEMENT               |          |     1 |    46 |  6522   (3)| 00:00:01 |        |   |               |
|   1 |  SORT AGGREGATE                |          |     1 |    46 |            |          |        |   |               |
|   2 |   PX COORDINATOR               |          |       |       |            |          |        |   |               |
|   3 |    PX SEND QC (RANDOM)         | :TQ10000 |     1 |    46 |            |          |  Q1,00 | P->S | QC (RAND)  |
|   4 |     SORT AGGREGATE             |          |     1 |    46 |            |          |  Q1,00 | PCWP |            |
|   5 |      PX BLOCK ITERATOR         |          |   659K|    28M|  6522   (3)| 00:00:01 |  Q1,00 | PCWC |            |
|*  6 |       TABLE ACCESS STORAGE FULL| TEST2    |   659K|    28M|  6522   (3)| 00:00:01 |  Q1,00 | PCWP |            |
------------------------------------------------------------------------------------------------------------------------

Predicate Information (identified by operation id):
---------------------------------------------------

   6 - storage("OWNER"='USER2' AND SUBSTR("OBJECT_TYPE",1,1)='T')
       filter("OWNER"='USER2' AND SUBSTR("OBJECT_TYPE",1,1)='T')

Note
-----
   - dynamic sampling used for this statement (level=5)
   - automatic DOP: Computed Degree of Parallelism is 3


Statistics
----------------------------------------------------------
         45  recursive calls
          4  db block gets
     926142  consistent gets
     922157  physical reads
       4656  redo size
        569  bytes sent via SQL*Net to client
        360  bytes received via SQL*Net from client
          2  SQL*Net roundtrips to/from client
          6  sorts (memory)
          0  sorts (disk)
          1  rows processed

SQL> alter system flush buffer_cache;

System altered.

Elapsed: 00:00:00.06
SQL> alter system flush shared_pool;

System altered.

Elapsed: 00:00:00.00
SQL> select /*+  */ avg(last_ddl_time-to_date('01-OCT-2010')), avg(created-to_date('01-OCT-2010')), count(*) from  test2 where owner = 'USER3' and substr(object_type,1,1)='T';

AVG(LAST_DDL_TIME-TO_DATE('01-OCT-2010')) AVG(CREATED-TO_DATE('01-OCT-2010'))   COUNT(*)
----------------------------------------- ----------------------------------- ----------
                               1511.14031                          1375.30824       3402

Elapsed: 00:00:20.48

Execution Plan
----------------------------------------------------------
Plan hash value: 1204039106

---------------------------------------------------------------------------------------------
| Id  | Operation                    | Name         | Rows  | Bytes | Cost (%CPU)| Time     |
---------------------------------------------------------------------------------------------
|   0 | SELECT STATEMENT             |              |     1 |    46 |  1436   (0)| 00:00:01 |
|   1 |  SORT AGGREGATE              |              |     1 |    46 |            |          |
|*  2 |   TABLE ACCESS BY INDEX ROWID| TEST2        |  5398 |   242K|  1436   (0)| 00:00:01 |
|*  3 |    INDEX RANGE SCAN          | INDEX1_TEST2 | 10159 |       |    45   (0)| 00:00:01 |
---------------------------------------------------------------------------------------------

Predicate Information (identified by operation id):
---------------------------------------------------

   2 - filter(SUBSTR("OBJECT_TYPE",1,1)='T')
   3 - access("OWNER"='USER3')

Note
-----
   - dynamic sampling used for this statement (level=2)
   - automatic DOP: Computed Degree of Parallelism is 1 because of parallel threshold


Statistics
----------------------------------------------------------
         32  recursive calls
          0  db block gets
      28382  consistent gets
      28015  physical reads
    1458488  redo size
        567  bytes sent via SQL*Net to client
        360  bytes received via SQL*Net from client
          2  SQL*Net roundtrips to/from client
          6  sorts (memory)
          0  sorts (disk)
          1  rows processed

Dynamic sampling on the diff columns has their own target, for parallel mode base on threshold, and parallel degree/distribute method for join columns.

Dynamic Statistics during the running time

Dynamic Sampling started from ORACLE 9i, and Renamed to dynamic statistics after ORACLE 12C. Basically, dynamic statistics is just for ORACLE optimizer to build the best execution plan, Before ORACLE 12C, the SQL parsing time would do the dynamic statistics if the existing statistics in dictionary is not sufficiency.

In 11G, ORACLE provide the extended statistics to address the multiplex columns filter which no standard statistics to tell the selectivity of query, however, such extended statistics as to be built manually. From 12C, ORACLE dynamic statistics would automatically add in the columns composition into the dictionary to let the gathering statistics auto generate the statistics as extended statistics to make optimizer more accuracy to computer the  combined columns statistics even cross the tables if query has long running time with tables join.

Dynamic statistics only be triggered when no enough statistics in dictionary to let optimizer computer the selective when it is COST base, and with estimated “big” size of segment, and it should on parallel mode. dynamic statistics only be used for complex query which optimizer has to use the selective to compute the COST of access path and parallel degree.

Rule one :  Parallel Mode + Estimated Fetching size + No enough statistics (either not existing or stale) ==> Dynamic statistics

Rule two: In 11g, parallel degree under auto drop is base on the  segment level scan, and not directly related with statistics, but in 12c, degree compute will be base on the statistics, and dynamic statistics would be triggered if statistics is idle.

Rule three: When column histogram existing, optimizer will respect to the histogram even dynamic statistics been triggered.

Cases study list below is check on:

  1. Parallel policy =’AUTO’  VS  force parallel via parallel hint
  2. Has statistics VS no statistics at all
  3. Has column histogram VS no histogram but with statistics.

All the execution plan was from 11GR2, for 12C, most cases are same, but parallel degree will be diffs. This paper only study when the dynamic statistics would be triggered and how it would impact the execution plan.

Case study only on one table,

  • column “OWNER” has no-even values, “USER1” and “USER2” has 80% records, and statistics been gathered;
  • Switched “USER2” to “USER3” w/o statistics updated.
  • No. of Records owner=’USER2′ is zero. but statistics showed 80% of total records.
  • No. of Records owner=’USER3′ is 80% of Total records, ut statistics showed zero of records.
  • There is histogram statistics on “OWNER” column.

Case 1: Add parallel hint on the query with “OWNER” column and one function on the column to trigger the dynamic statistics base rule one.

SQL> select /*+ parallel(32) */ avg(last_ddl_time-sysdate), avg(created-sysdate) from  test2 where owner = 'USER2' and substr(object_type,1,3)='TAB';

AVG(LAST_DDL_TIME-SYSDATE) AVG(CREATED-SYSDATE)
-------------------------- --------------------


Elapsed: 00:00:00.68
Execution Plan
----------------------------------------------------------
Plan hash value: 2571823673

------------------------------------------------------------------------------------------------------------------------
| Id  | Operation                      | Name     | Rows  | Bytes | Cost (%CPU)| Time     |    TQ  |IN-OUT| PQ Distrib |
------------------------------------------------------------------------------------------------------------------------   
|   0 | SELECT STATEMENT               |          |     1 |    35 |   117   (6)| 00:00:01 |        |   |               |
|   1 |  SORT AGGREGATE                |          |     1 |    35 |            |          |        |   |               |
|   2 |   PX COORDINATOR               |          |       |       |            |          |        |   |               |
|   3 |    PX SEND QC (RANDOM)         | :TQ10000 |     1 |    35 |            |          |  Q1,00 | P->S | QC (RAND)  |
|   4 |     SORT AGGREGATE             |          |     1 |    35 |            |          |  Q1,00 | PCWP |            |
|   5 |      PX BLOCK ITERATOR         |          |  1800 | 63000 |   117   (6)| 00:00:01 |  Q1,00 | PCWC |            |
|*  6 |       TABLE ACCESS STORAGE FULL| TEST2    |  1800 | 63000 |   117   (6)| 00:00:01 |  Q1,00 | PCWP |            |
------------------------------------------------------------------------------------------------------------------------
Predicate Information (identified by operation id):
---------------------------------------------------
6 - storage("OWNER"='USER2' AND SUBSTR("OBJECT_TYPE",1,3)='TAB')
       filter("OWNER"='USER2' AND SUBSTR("OBJECT_TYPE",1,3)='TAB')

Note
-----
   - dynamic sampling used for this statement (level=5)
   - Degree of Parallelism is 32 because of hint


Statistics
----------------------------------------------------------
        176  recursive calls
          0  db block gets
     200701  consistent gets
     171375  physical reads
    3817584  redo size
        433  bytes sent via SQL*Net to client
        360  bytes received via SQL*Net from client
          2  SQL*Net roundtrips to/from client
          7  sorts (memory)
          0  sorts (disk)
          1  rows processed

It ran with dynamic statistics due to force parallel and statistics histogram showed fetching size is Big.

SQL> select /*+ parallel(32) */ avg(last_ddl_time-sysdate), avg(created-sysdate) from  test2 where owner = 'USER3' and substr(object_type,1,3)='TAB';

AVG(LAST_DDL_TIME-SYSDATE) AVG(CREATED-SYSDATE)
-------------------------- --------------------
                -577.32249           -870.46987

Elapsed: 00:00:16.08

Execution Plan
----------------------------------------------------------
Plan hash value: 1204039106

---------------------------------------------------------------------------------------------
| Id  | Operation                    | Name         | Rows  | Bytes | Cost (%CPU)| Time     |
---------------------------------------------------------------------------------------------
|   0 | SELECT STATEMENT             |              |     1 |    35 |    24   (0)| 00:00:01 |
|   1 |  SORT AGGREGATE              |              |     1 |    35 |            |          |
|*  2 |   TABLE ACCESS BY INDEX ROWID| TEST2        |   955K|    31M|    24   (0)| 00:00:01 |
|*  3 |    INDEX RANGE SCAN          | INDEX1_TEST2 |   889 |       |     5   (0)| 00:00:01 |
---------------------------------------------------------------------------------------------

Predicate Information (identified by operation id):
---------------------------------------------------

   2 - filter(SUBSTR("OBJECT_TYPE",1,3)='TAB')
   3 - access("OWNER"='USER3')

Note
-----
   - dynamic sampling used for this statement (level=5)
   - Degree of Parallelism is 1 because of hint

Statistics
----------------------------------------------------------
          4  recursive calls
          0  db block gets
      86487  consistent gets
       9845  physical reads
     600732  redo size
        475  bytes sent via SQL*Net to client
        360  bytes received via SQL*Net from client
          2  SQL*Net roundtrips to/from client
          0  sorts (memory)
          0  sorts (disk)
          1  rows processed

Even USER3 has 80% of records, and It ran with dynamic statistics on two columns composite statistics, and not impact the OWNER column since it had the statistics,execution plan base on histogram, and parallel degree downgrade to 1 since No. of records in histogram show zero.

SQL> select /*+ parallel(32) */ avg(last_ddl_time-sysdate), avg(created-sysdate) from  test2 where owner = 'USER1' and substr(object_type,1,3)='TAB';

AVG(LAST_DDL_TIME-SYSDATE) AVG(CREATED-SYSDATE)
-------------------------- --------------------
                -436.46116            -461.3455

Elapsed: 00:00:00.42

Execution Plan
----------------------------------------------------------
Plan hash value: 2571823673

------------------------------------------------------------------------------------------------------------------------
| Id  | Operation                      | Name     | Rows  | Bytes | Cost (%CPU)| Time     |    TQ  |IN-OUT| PQ Distrib |
------------------------------------------------------------------------------------------------------------------------
|   0 | SELECT STATEMENT               |          |     1 |    35 |   118   (6)| 00:00:01 |        |   |               |
|   1 |  SORT AGGREGATE                |          |     1 |    35 |            |          |        |   |               |
|   2 |   PX COORDINATOR               |          |       |       |            |          |        |   |               |
|   3 |    PX SEND QC (RANDOM)         | :TQ10000 |     1 |    35 |            |          |  Q1,00 | P->S | QC (RAND)  |
|   4 |     SORT AGGREGATE             |          |     1 |    35 |            |          |  Q1,00 | PCWP |            |
|   5 |      PX BLOCK ITERATOR         |          |  2423K|    80M|   118   (6)| 00:00:01 |  Q1,00 | PCWC |            |
|*  6 |       TABLE ACCESS STORAGE FULL| TEST2    |  2423K|    80M|   118   (6)| 00:00:01 |  Q1,00 | PCWP |            |
------------------------------------------------------------------------------------------------------------------------
Predicate Information (identified by operation id):
---------------------------------------------------
   6 - storage("OWNER"='USER1' AND SUBSTR("OBJECT_TYPE",1,3)='TAB')
       filter("OWNER"='USER1' AND SUBSTR("OBJECT_TYPE",1,3)='TAB')
Note
-----
   - dynamic sampling used for this statement (level=5)
   - Degree of Parallelism is 32 because of hint

Statistics
----------------------------------------------------------
        100  recursive calls
          0  db block gets
     200629  consistent gets
          0  physical reads
       2952  redo size
        475  bytes sent via SQL*Net to client
        360  bytes received via SQL*Net from client
          2  SQL*Net roundtrips to/from client
          0  sorts (memory)
          0  sorts (disk)
          1  rows processed

For column owner=’USER’, the statistics and actual distribute value is matched.
Case 2:  We drop the histogram, and keep the column OWNER statistics.

SQL> select /*+ parallel(32) */ avg(last_ddl_time-to_date('01-OCT-2010')), avg(created-to_date('01-OCT-2010')), count(*) from  test2 where owner = 'USER2' and substr(object_type,1,1)='T

AVG(LAST_DDL_TIME-TO_DATE('01-OCT-2010')) AVG(CREATED-TO_DATE('01-OCT-2010'))   COUNT(*)
----------------------------------------- ----------------------------------- ----------
                               1291.74533                          1000.87406    1065024
Elapsed: 00:00:01.04
Execution Plan
----------------------------------------------------------
Plan hash value: 2571823673
------------------------------------------------------------------------------------------------------------------------
| Id  | Operation                      | Name     | Rows  | Bytes | Cost (%CPU)| Time     |    TQ  |IN-OUT| PQ Distrib |
------------------------------------------------------------------------------------------------------------------------
|   0 | SELECT STATEMENT               |          |     1 |    38 |   612   (3)| 00:00:01 |        |   |               |
|   1 |  SORT AGGREGATE                |          |     1 |    38 |            |          |        |   |               |
|   2 |   PX COORDINATOR               |          |       |       |            |          |        |   |               |
|   3 |    PX SEND QC (RANDOM)         | :TQ10000 |     1 |    38 |            |          |  Q1,00 | P->S | QC (RAND)  |
|   4 |     SORT AGGREGATE             |          |     1 |    38 |            |          |  Q1,00 | PCWP |            |
|   5 |      PX BLOCK ITERATOR         |          |   640K|    23M|   612   (3)| 00:00:01 |  Q1,00 | PCWC |            |
|*  6 |       TABLE ACCESS STORAGE FULL| TEST2    |   640K|    23M|   612   (3)| 00:00:01 |  Q1,00 | PCWP |            |
------------------------------------------------------------------------------------------------------------------------

Predicate Information (identified by operation id):
---------------------------------------------------

   6 - storage("OWNER"='USER2' AND SUBSTR("OBJECT_TYPE",1,1)='T')
       filter("OWNER"='USER2' AND SUBSTR("OBJECT_TYPE",1,1)='T')

Note
-----
   - dynamic sampling used for this statement (level=5)
   - Degree of Parallelism is 32 because of hint


Statistics
----------------------------------------------------------
        135  recursive calls
          0  db block gets
     955823  consistent gets
     922152  physical reads
       4552  redo size
        569  bytes sent via SQL*Net to client
        360  bytes received via SQL*Net from client
          2  SQL*Net roundtrips to/from client
          6  sorts (memory)
          0  sorts (disk)
          1  rows processed

SQL> alter system flush buffer_cache;

System altered.

Elapsed: 00:00:00.06
SQL> alter system flush shared_pool;

System altered.

Elapsed: 00:00:00.01
SQL> select /*+ parallel(32) */ avg(last_ddl_time-to_date('01-OCT-2010')), avg(created-to_date('01-OCT-2010')), count(*) from  test2 where owner = 'USER3' and substr(object_type,1,1)='T

AVG(LAST_DDL_TIME-TO_DATE('01-OCT-2010')) AVG(CREATED-TO_DATE('01-OCT-2010'))   COUNT(*)
----------------------------------------- ----------------------------------- ----------
                               1511.14031                          1375.30824       3402

Elapsed: 00:00:01.01

Execution Plan
----------------------------------------------------------
Plan hash value: 2571823673

------------------------------------------------------------------------------------------------------------------------
| Id  | Operation                      | Name     | Rows  | Bytes | Cost (%CPU)| Time     |    TQ  |IN-OUT| PQ Distrib |
------------------------------------------------------------------------------------------------------------------------
|   0 | SELECT STATEMENT               |          |     1 |    38 |   612   (3)| 00:00:01 |        |   |               |
|   1 |  SORT AGGREGATE                |          |     1 |    38 |            |          |        |   |               |
|   2 |   PX COORDINATOR               |          |       |       |            |          |        |   |               |
|   3 |    PX SEND QC (RANDOM)         | :TQ10000 |     1 |    38 |            |          |  Q1,00 | P->S | QC (RAND)  |
|   4 |     SORT AGGREGATE             |          |     1 |    38 |            |          |  Q1,00 | PCWP |            |
|   5 |      PX BLOCK ITERATOR         |          | 18067 |   670K|   612   (3)| 00:00:01 |  Q1,00 | PCWC |            |
|*  6 |       TABLE ACCESS STORAGE FULL| TEST2    | 18067 |   670K|   612   (3)| 00:00:01 |  Q1,00 | PCWP |            |
------------------------------------------------------------------------------------------------------------------------

Predicate Information (identified by operation id):
---------------------------------------------------

   6 - storage("OWNER"='USER3' AND SUBSTR("OBJECT_TYPE",1,1)='T')
       filter("OWNER"='USER3' AND SUBSTR("OBJECT_TYPE",1,1)='T')
Note
-----
   - Degree of Parallelism is 32 because of hint

Statistics
----------------------------------------------------------
        135  recursive calls
          0  db block gets
     955823  consistent gets
     922152  physical reads
       4552  redo size
        567  bytes sent via SQL*Net to client
        360  bytes received via SQL*Net from client
          2  SQL*Net roundtrips to/from client
          6  sorts (memory)
          0  sorts (disk)
          1  rows processed

Delete the histogram, ORACLE use AVG to decide whether full table or indexes, and dynamic statistics only gather on the composite columns which no statistics on them, However, in 12C, ORACLE would automatically add the composite columns into table extended statistics.

If we delete the whole statistics, then dynamic statistics would on OWNER column and composite columns both.

Case 3: No statistics on the table.

SQL> select /*+ parallel(32) */ avg(last_ddl_time-to_date('01-OCT-2010')), avg(created-to_date('01-OCT-2010')), count(*) from  test2 where owner = 'USER2' and substr(object_type,1,1)='T';

AVG(LAST_DDL_TIME-TO_DATE('01-OCT-2010')) AVG(CREATED-TO_DATE('01-OCT-2010'))   COUNT(*)
----------------------------------------- ----------------------------------- ----------
                               1291.74533                          1000.87406    1065024

Elapsed: 00:00:01.10

Execution Plan
----------------------------------------------------------
Plan hash value: 2571823673

------------------------------------------------------------------------------------------------------------------------
| Id  | Operation                      | Name     | Rows  | Bytes | Cost (%CPU)| Time     |    TQ  |IN-OUT| PQ Distrib |
------------------------------------------------------------------------------------------------------------------------
|   0 | SELECT STATEMENT               |          |     1 |    46 |   611   (3)| 00:00:01 |        |   |               |
|   1 |  SORT AGGREGATE                |          |     1 |    46 |            |          |        |   |               |
|   2 |   PX COORDINATOR               |          |       |       |            |          |        |   |               |
|   3 |    PX SEND QC (RANDOM)         | :TQ10000 |     1 |    46 |            |          |  Q1,00 | P->S | QC (RAND)  |
|   4 |     SORT AGGREGATE             |          |     1 |    46 |            |          |  Q1,00 | PCWP |            |
|   5 |      PX BLOCK ITERATOR         |          |   659K|    28M|   611   (3)| 00:00:01 |  Q1,00 | PCWC |            |
|*  6 |       TABLE ACCESS STORAGE FULL| TEST2    |   659K|    28M|   611   (3)| 00:00:01 |  Q1,00 | PCWP |            |
------------------------------------------------------------------------------------------------------------------------

Predicate Information (identified by operation id):
---------------------------------------------------

   6 - storage("OWNER"='USER2' AND SUBSTR("OBJECT_TYPE",1,1)='T')
       filter("OWNER"='USER2' AND SUBSTR("OBJECT_TYPE",1,1)='T')
Note
-----
   - dynamic sampling used for this statement (level=5)
   - Degree of Parallelism is 32 because of hint

Statistics
----------------------------------------------------------
        129  recursive calls
          0  db block gets
     956242  consistent gets
     922154  physical reads
       4552  redo size
        569  bytes sent via SQL*Net to client
        360  bytes received via SQL*Net from client
          2  SQL*Net roundtrips to/from client
          6  sorts (memory)
          0  sorts (disk)
          1  rows processed

SQL> alter system flush buffer_cache;

System altered.

Elapsed: 00:00:00.07
SQL> alter system flush shared_pool;

System altered.

Elapsed: 00:00:00.01
SQL> select /*+ parallel(32) */ avg(last_ddl_time-to_date('01-OCT-2010')), avg(created-to_date('01-OCT-2010')), count(*) from  test2 where owner = 'USER3' and substr(object_type,1,1)='T';

AVG(LAST_DDL_TIME-TO_DATE('01-OCT-2010')) AVG(CREATED-TO_DATE('01-OCT-2010'))   COUNT(*)
----------------------------------------- ----------------------------------- ----------
                               1511.14031                          1375.30824       3402

Elapsed: 00:00:01.07

Execution Plan
----------------------------------------------------------
Plan hash value: 2571823673

------------------------------------------------------------------------------------------------------------------------
| Id  | Operation                      | Name     | Rows  | Bytes | Cost (%CPU)| Time     |    TQ  |IN-OUT| PQ Distrib |
------------------------------------------------------------------------------------------------------------------------
|   0 | SELECT STATEMENT               |          |     1 |    46 |   611   (3)| 00:00:01 |        |   |               |
|   1 |  SORT AGGREGATE                |          |     1 |    46 |            |          |        |   |               |
|   2 |   PX COORDINATOR               |          |       |       |            |          |        |   |               |
|   3 |    PX SEND QC (RANDOM)         | :TQ10000 |     1 |    46 |            |          |  Q1,00 | P->S | QC (RAND)  |
|   4 |     SORT AGGREGATE             |          |     1 |    46 |            |          |  Q1,00 | PCWP |            |
|   5 |      PX BLOCK ITERATOR         |          |  5398 |   242K|   611   (3)| 00:00:01 |  Q1,00 | PCWC |            |
|*  6 |       TABLE ACCESS STORAGE FULL| TEST2    |  5398 |   242K|   611   (3)| 00:00:01 |  Q1,00 | PCWP |            |
------------------------------------------------------------------------------------------------------------------------

Predicate Information (identified by operation id):
---------------------------------------------------

   6 - storage("OWNER"='USER3' AND SUBSTR("OBJECT_TYPE",1,1)='T')
       filter("OWNER"='USER3' AND SUBSTR("OBJECT_TYPE",1,1)='T')
Note
-----
   - dynamic sampling used for this statement (level=5)
   - Degree of Parallelism is 32 because of hint

Statistics
----------------------------------------------------------
        129  recursive calls
          0  db block gets
     956242  consistent gets
     922154  physical reads
       4552  redo size
        567  bytes sent via SQL*Net to client
        360  bytes received via SQL*Net from client
          2  SQL*Net roundtrips to/from client
          6  sorts (memory)
          0  sorts (disk)
          1  rows processed

Optimizer didn’t pick up the index even the fetching % is typical small. The reason is force parallel runs, would disable index acess. If remove the hint and set optimizer on policy = AUTO mode.

Case 5: No statistics and parallel policy = AUTO

SQL> select /*+  */ avg(last_ddl_time-to_date('01-OCT-2010')), avg(created-to_date('01-OCT-2010')), count(*) from  test2 where owner = 'USER2' and substr(object_type,1,1)='T';

AVG(LAST_DDL_TIME-TO_DATE('01-OCT-2010')) AVG(CREATED-TO_DATE('01-OCT-2010'))   COUNT(*)
----------------------------------------- ----------------------------------- ----------
                               1291.74533                          1000.87406    1065024

Elapsed: 00:00:02.34

Execution Plan
----------------------------------------------------------
Plan hash value: 2571823673

------------------------------------------------------------------------------------------------------------------------
| Id  | Operation                      | Name     | Rows  | Bytes | Cost (%CPU)| Time     |    TQ  |IN-OUT| PQ Distrib |
------------------------------------------------------------------------------------------------------------------------
|   0 | SELECT STATEMENT               |          |     1 |    46 |  6522   (3)| 00:00:01 |        |   |               |
|   1 |  SORT AGGREGATE                |          |     1 |    46 |            |          |        |   |               |
|   2 |   PX COORDINATOR               |          |       |       |            |          |        |   |               |
|   3 |    PX SEND QC (RANDOM)         | :TQ10000 |     1 |    46 |            |          |  Q1,00 | P->S | QC (RAND)  |
|   4 |     SORT AGGREGATE             |          |     1 |    46 |            |          |  Q1,00 | PCWP |            |
|   5 |      PX BLOCK ITERATOR         |          |   659K|    28M|  6522   (3)| 00:00:01 |  Q1,00 | PCWC |            |
|*  6 |       TABLE ACCESS STORAGE FULL| TEST2    |   659K|    28M|  6522   (3)| 00:00:01 |  Q1,00 | PCWP |            |
------------------------------------------------------------------------------------------------------------------------

Predicate Information (identified by operation id):
---------------------------------------------------

   6 - storage("OWNER"='USER2' AND SUBSTR("OBJECT_TYPE",1,1)='T')
       filter("OWNER"='USER2' AND SUBSTR("OBJECT_TYPE",1,1)='T')

Note
-----
   - dynamic sampling used for this statement (level=5)
   - automatic DOP: Computed Degree of Parallelism is 3


Statistics
----------------------------------------------------------
         45  recursive calls
          4  db block gets
     926142  consistent gets
     922157  physical reads
       4656  redo size
        569  bytes sent via SQL*Net to client
        360  bytes received via SQL*Net from client
          2  SQL*Net roundtrips to/from client
          6  sorts (memory)
          0  sorts (disk)
          1  rows processed

SQL> alter system flush buffer_cache;

System altered.

Elapsed: 00:00:00.06
SQL> alter system flush shared_pool;

System altered.

Elapsed: 00:00:00.00
SQL> select /*+  */ avg(last_ddl_time-to_date('01-OCT-2010')), avg(created-to_date('01-OCT-2010')), count(*) from  test2 where owner = 'USER3' and substr(object_type,1,1)='T';

AVG(LAST_DDL_TIME-TO_DATE('01-OCT-2010')) AVG(CREATED-TO_DATE('01-OCT-2010'))   COUNT(*)
----------------------------------------- ----------------------------------- ----------
                               1511.14031                          1375.30824       3402

Elapsed: 00:00:20.48

Execution Plan
----------------------------------------------------------
Plan hash value: 1204039106

---------------------------------------------------------------------------------------------
| Id  | Operation                    | Name         | Rows  | Bytes | Cost (%CPU)| Time     |
---------------------------------------------------------------------------------------------
|   0 | SELECT STATEMENT             |              |     1 |    46 |  1436   (0)| 00:00:01 |
|   1 |  SORT AGGREGATE              |              |     1 |    46 |            |          |
|*  2 |   TABLE ACCESS BY INDEX ROWID| TEST2        |  5398 |   242K|  1436   (0)| 00:00:01 |
|*  3 |    INDEX RANGE SCAN          | INDEX1_TEST2 | 10159 |       |    45   (0)| 00:00:01 |
---------------------------------------------------------------------------------------------

Predicate Information (identified by operation id):
---------------------------------------------------

   2 - filter(SUBSTR("OBJECT_TYPE",1,1)='T')
   3 - access("OWNER"='USER3')

Note
-----
   - dynamic sampling used for this statement (level=2)
   - automatic DOP: Computed Degree of Parallelism is 1 because of parallel threshold


Statistics
----------------------------------------------------------
         32  recursive calls
          0  db block gets
      28382  consistent gets
      28015  physical reads
    1458488  redo size
        567  bytes sent via SQL*Net to client
        360  bytes received via SQL*Net from client
          2  SQL*Net roundtrips to/from client
          6  sorts (memory)
          0  sorts (disk)
          1  rows processed

When policy = auto, Optimizer would estimate the running time, if less than 30 seconds (or 10 seconds), it would run parallel. Then Optimizer able to compare the cost by statistics value or dynamic statistics value.

Dynamic statistics be used for optimizer to decide the access path, but statistics in dictionary is not enough; and for optimizer to decide whether should run the parallel or not if the session on auto DOP mode. When join with other table, dynamic statistics would be gathered on the columns cross the tables, and in 12C, it may be recorded and act as extended column – cluster tables.

Exadata Smart scan, Storage index and cell flash cache

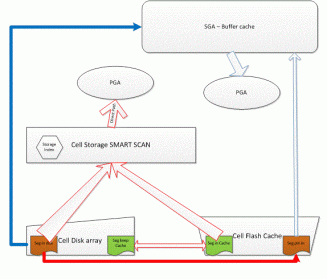
As we knew, Exadata SMART scan work on the storage level — cell servers in exadata box, it applies to full segment scan and storage index will help on this.

Exadata smart scan does the below :

  1. It using the storage index to filter the data blocks in storage disk/flash cache;
  2. It filters out the columns which doesn’t needed for the query at storage level;
  3. SMART scan pass the results to PGA directly, so only direct patch I/O able benefits from smart scan.
  4. PGA not data block base, not like SGA buffer cache must store and operates as data block unit which need link to undo segment for data consistence;
  5. So only parallel query on exadata able benefit from smart scan, or setup serial query force on smart scan via _serial_direct_read = TRUE;
  6. Direct path I/O for direct loading  need exclusive lock on segment to protect data consistence.
  7. SMART scan only off load the table/index from storage flash cache with the table/index defined as cell_flash_cache=keep .

post

Direct I/O play key role in the smart scan, in the 11G/12C database one hide parameter control whether can perform direct I/O also,  _small_table_threshold will decides whether can be direct path read or access via buffer cache. In 11G, the segment size was capture from the segment head, and ORACLE change to direct use statistics on the segment in 12c.

Exadata can be good for DW query is base on DW query normally need access big tables and join them; so smart scan will reduce the data transfer from storage to DB server (PGA), and such filter and trim columns all done at storage level w/o  consume DB server resource, and it support the parallel slave for concurrent accesses; Exadata can be goof for the OLTP, is due to smart flash cache and data buffer, smart flash cache just cache the data block at each storage level for the storage local disks. Any I/O happened in Exadata, storage always write back to flash cache if it is not full segment scan. And After Exadata X3, the write back cache  can be configured to make segment write I/O first to flash cache and release the data buffer and undo segment quickly.

In ORACLE 11GR2, parallel in memory comes with parallel policy = AUTO. Parallel in memory change the parallel picture , parallel slave no longer do own direct I/O to own PGA, and parallel in memory would transfer the data into data buffer and access the data from data buffer even it runs on parallel mode. Good thing is data buffer data can shared for global use and reduce the physical I/O on storage server; but is simply make smart scan disable.

From v$mystat from session level can tell how much benefit from smart scan, from smart flash cache and from data buffer. Here will not compare the performance, just provide how to extract such statistics from live run.

Case 1 :

To enable direct patch read, run the query in parallel policy = manual; the query should from cell server direct feed data into PGA and with smart scan, cell flash cache hit should low (no full segment in the cell flash cache).

       SID STATISTIC# NAME                                                                            VALUE 
---------- ---------- ---------------------------------------------------------------- -------------------- 
       719         64 cell physical IO interconnect bytes                                     3,091,239,080 
       719         84 db block gets                                                                     311 
       719         88 consistent gets                                                               413,213 
       719         94 physical reads                                                                483,640 
       719         95 physical reads cache                                                            2,105 
       719         96 physical read flash cache hits                                                      0 
       719         97 physical reads direct                                                         481,535 
       719         98 physical read IO requests                                                       6,496 
       719         99 physical read bytes                                                     3,961,978,880 
       719        273 cell physical IO bytes eligible for predicate offload                   3,158,982,656 
       719        274 cell physical IO bytes saved by storage index                                       0 
       719        290 cell physical IO interconnect bytes returned by smart scan                716,738,728 
       719        646 cell flash cache read hits                                                      3,563 

Case 2:

After “alter table “ to set cell_flash_cache=KEEP, and run three time to make sure full cache into flash cache, same query with below running statistics.

       SID STATISTIC# NAME                                                                            VALUE 
---------- ---------- ---------------------------------------------------------------- -------------------- 
      1237         64 cell physical IO interconnect bytes                                     3,122,517,112 
      1237         84 db block gets                                                                     315 
      1237         88 consistent gets                                                               422,895 
      1237         94 physical reads                                                                487,558 
      1237         95 physical reads cache                                                            6,073 
      1237         96 physical read flash cache hits                                                      0 
      1237         97 physical reads direct                                                         481,485 
      1237         98 physical read IO requests                                                       8,037 
      1237         99 physical read bytes                                                     3,994,075,136 
      1237        273 cell physical IO bytes eligible for predicate offload                   3,158,982,656 
      1237        274 cell physical IO bytes saved by storage index                                       0 
      1237        290 cell physical IO interconnect bytes returned by smart scan                716,739,704 
      1237        646 cell flash cache read hits                                                      5,298                       
Compares with CASE 1, more flash cache read hits, and same SMART scan rate.

Case 3:

Once change the parallel policy = AUTO, ORACLE would implement in-memory parallel, which use SGA in the segment in the buffer cache, no direct path read and turn off the smart scan for those objects. Cell flash cache play the same role for this run.

set cell_flash_cache=KEEP,

       SID STATISTIC# NAME                                                                            VALUE 
---------- ---------- ---------------------------------------------------------------- -------------------- 
       460         64 cell physical IO interconnect bytes                                     2,285,816,344 
       460         84 db block gets                                                                     324 
       460         88 consistent gets                                                               425,630 
       460         94 physical reads                                                                279,036 
       460         95 physical reads cache                                                          279,024 
       460         96 physical read flash cache hits                                                      0 
       460         97 physical reads direct                                                              12 
       460         98 physical read IO requests                                                       4,857 
       460         99 physical read bytes                                                     2,285,862,912 
       460        273 cell physical IO bytes eligible for predicate offload                          81,920 
       460        274 cell physical IO bytes saved by storage index                                       0 
       460        290 cell physical IO interconnect bytes returned by smart scan                      2,584 
       460        646 cell flash cache read hits                                                      4,851 

When parallel slaves access SGA buffer cache, SMART scan compare case1 and 2 much less, direct read much less and read cache increased.

Actual running performance didn’t show keep in cell flash cache always better, Exadata SMART flash cache would cache the data block when I/O on data blocks.


ALL_* view in the PL/SQL store procedure

Access the all_* view direct from session, the all_* would output all the own objects plus all the objects been granted either direct or under public or through the roles that had granted to the account.

If check below in the account session using SQL:

SQL> select count(*) from all_tables;
 COUNT(*)
----------
     17048

And if in the anonym block, the result is same:

SQL> declare
2 a number;
3 begin
4 select count(*) into a from all_tables;
5 dbms_output.put_line('No. of tables:'||to_char(a))
6 end;
7 /
No. of tables:17048

PL/SQL procedure successfully completed.

But if runs in the stored procedure, the result would be difference:

create or replace procedure test_all_view_1 as
a number;
BEGIN
     select count(*) into a from all_tables;
     dbms_output.put_line('no. of tables:'||to_char(a));
end test_all_view_1;
/
SQL> exec test_all_view_1;
no of tables:44
PL/SQL procedure successfully completed.

And the result just match to own tables plus direct granted tables (include direct granted to public) :

SQL> select count(*) from all_tab_privs 
     where privilege='SELECT' and grantee in ('PUBLIC','TESTAC') 
       and table_name in (select table_name from all_tables);
COUNT(*)
----------
       42
SQL> select count(*) from user_tables;
COUNT(*)
----------
         2
SQL>show user
TESTAC

In All_* views, Privileges from direct grant and roles will be checked by system to find any minimum access privilege on the table (“select”), ALL_* view self was granted by default. But ALL_* has join conditions with user’s privilege.   In SQL engine, such join include the object privileges granted to the roles (which in the session_roles). However, PLSQL engine never take in the user privileges unless it is from dynamic SQL which running space switch to SQL engine, or DB link which creates another session and SQL runs under SQL engine.

ORACLE EM cloud control 12c — Real Time SQL monitoring

ORACLE EM cloud control 12c — Real Time SQL monitoring

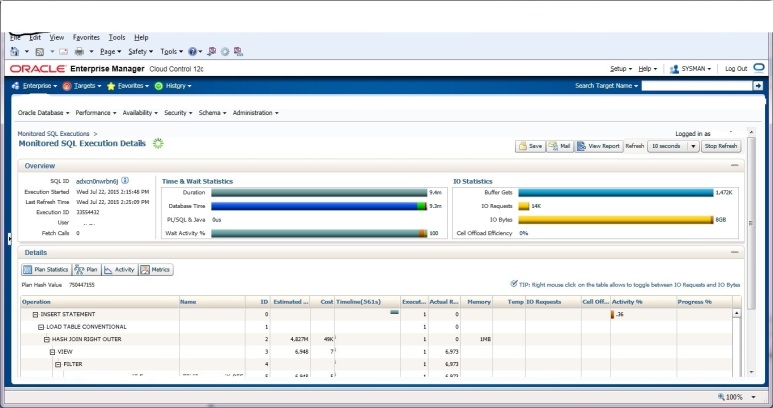
In ORACLE EM, started from 11g, there is real time SQL monitoring for monitor the query/SQL executing running time statistics, included resource usage, actual time spends in each of step. This tool is also available in SQL developer. However, sometime, you mayn’t find the fired running query, and you unable to view the online real time SQL monitoring dashboard in the EM 12c.

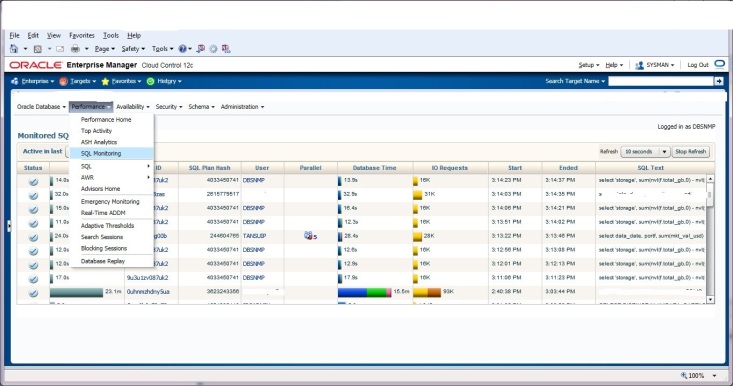
Most of time, DBA would lunch the SQL monitoring dashboard to do the monitoring on the running SQL, however, it would lead you to SQL Detail w/o SQL plan online statistics tab.

oem_4

From the “Monitored SQL Executions” page, double click the SQL ID, “SQL detail page” will show up.

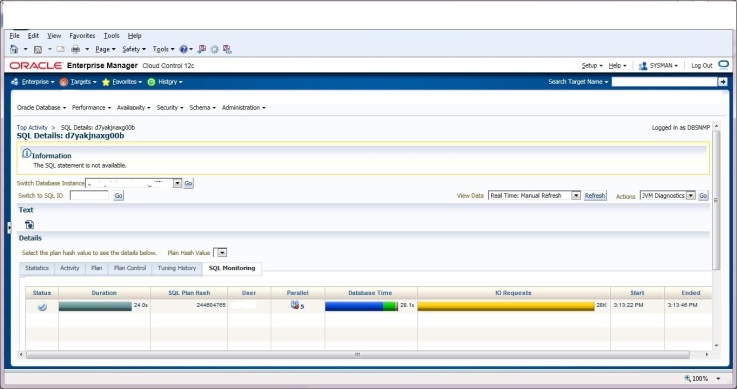
oem_5

This page will not display the SQL running statistics and time consuming.

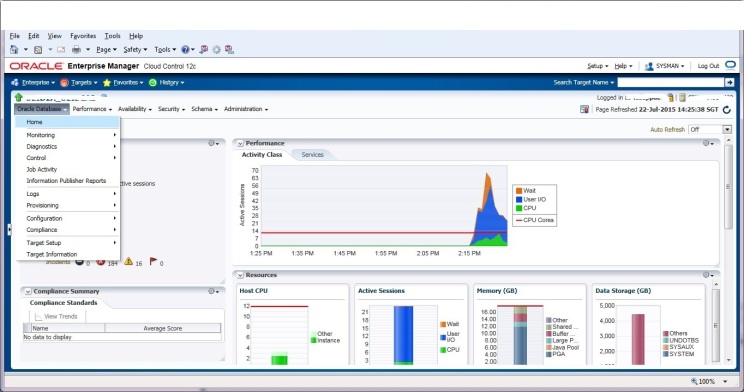
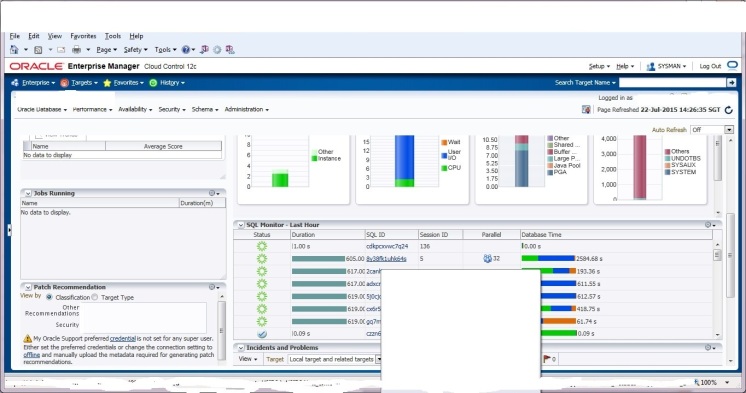
In order to do the online execution plan monitoring, you need lunch the dashboard from database home page, and find the SQL ID in the “SQL Monitor” segment.

oem_1

From “SQL Monitor” section in home page, it will lead you to the monitoring dashboard for you do the performance tuning and troubleshooting.

oem_2

Double click the SQL ID, “Monitored SQL Execution Detail” for this SQL ID will pop up and it can be auto refreshed.

oem_3

However, sometime, you may unable to find the detail due to the plan too “big”, ORACLE internal has threshold for sql monitoring, and simply control the No. of line in plan, the default value is 300 lines. And hide parameter “_sqlmon_max_planlines” used for control this. Simple increase “_sqlmon_max_planlines” to view the “BIG” sql when the plan line exceed the threshold.

There is new column – “others” in real time SQL monitoring dashboard for DB on 12c. This column contain extract information for parallel DOP downgraded. But not available for 11G database.

Real Time SQL monitoring is the great tool to help DBA tune the SQL and troubleshooting the performance of SQL. And it is in SQL developer.